
China and The Re-opening Trade: How Long will it Last?

Chris Watling, Longview Economics
“[The] real estate sector is still a pillar for China's economy. It accounts for nearly 40 percent of bank lending, 50 percent of overall local government fiscal resources, and 60 percent of urban household assets.”
Just three months ago, China was tightening its covid restrictions, enforcing lockdowns in major cities, and the authorities were praising the success of ‘Zero covid’. All of that added to the view in western markets that China was becoming increasingly ‘uninvestable’.
Unsurprisingly therefore, given the sudden re-opening and reversal of the ZERO COVID policy, the mood has shifted sharply and a rapid re-pricing of Chinese asset prices is underway.
The Chinese authorities have switched from significantly depressing activity via lockdowns, to rapidly reflating the economy by opening up. As the cartoon suggests, economic data is about to turn notably higher.
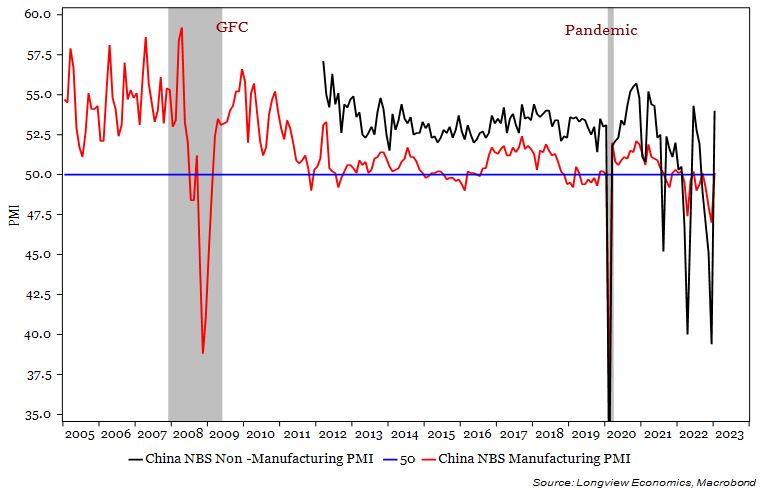
PMI readings, for example, like the ones shown in FIG 1 below, having been artificially supressed, should pick up sharply (particularly the services PMI), along with other indicators, in a similar manner to their pick-up in 2H 2020.
Linked to that, the consumer should also start spending some of the spare cash that has been built up in the past three years. According to the latest data, household bank deposits have grown by 17% Y-o-Y (i.e. an increase of RMB 20 trillion in the past 12 months alone). Deposits now stand at nearly 100% of GDP – up approximately 20 percentage points (from 82.4% in 2019).
The key question is: Does China’s recovery have legs? Is this the start of a multi-year, sustained recovery in economic activity? Or, will it be ‘short and sharp’, perhaps only lasting for the next 6 - 9 months? And, linked to that, how sustainable is the new uptrend in commodity prices? Furthermore, what will be the impact on global growth as well as US/global inflation.
FIG 1: Chinese manufacturing and nonmanufacturing PMI
In our view, a meaningful and enduring recovery in China is unlikely, in the absence of one or more of the following:
(i) a significant and prolonged (i.e. multi-year) housing recovery;
(ii) a reacceleration in infrastructure spending/build out;
(iii) a phase of strong export growth.
With respect to (iii), the outlook for China is reasonably poor, given that US and global recession risks are high/rising. Equally, though, neither (i) nor (ii) are likely, unless there is significant stimulus/monetary policy easing in China. Below we examine that in the context of housing, i.e. point (i), which overlaps somewhat with infrastructure spending. We then address the inflationary impact of China’s re-opening on the global economy.
Overall though, the evidence for a large/sustained re-leveraging of China’s economy is limited. As such, and while China’s ‘re-opening bounce’ may be sharp, it’s likely to be reasonably short lived (a 2023 story), especially given the outlook for the US/global economy this year. The renewed uptrend in commodities, and other China-sensitive assets is therefore also likely to be short-lived.
China: Where Housing Goes, So Goes the Economy
Housing is the key lens through which to think about and answer some of those questions. As Rogoff and Yang showed in August 2020, real estate accounts for about 30% of China’s GDP (including direct and indirect links). It therefore makes up the bulk of household assets, bank lending, local government revenues, and so on (as highlighted by Vice premier Liu He in the quote above).
A number of recent policy changes are encouraging in that respect. The ‘three red lines’ for property developers, for example, have been loosened (albeit in a limited/pilot scheme) and a ‘21-task action plan’ to support ‘good quality’ developers has been launched. The authorities also announced a ‘16 point plan’ in November and have given local and regional governments some freedom to support the housing sector. All of that, coupled with broader economic re-opening, will no doubt generate a bounce in housing activity albeit from deeply depressed levels.
Historically though, sustained housing recoveries have been driven by a marked loosening of monetary policy and linked to that, a phase of strong credit growth. Those factors previously led to a reacceleration in land sales, construction activity, mortgage lending, and house price growth.
The chart below illustrates this. The credit impulse* typically leads land sales to property developers by about three months as shown in FIG 2 (as well as leading a number of other housing indicators). Without a meaningful turn higher in the credit cycle, therefore, a sustained recovery in housing is unlikely.
FIG 2: Chinese credit impulse* (adv 3m) vs. land sales to property developers (Y-o-Y %)
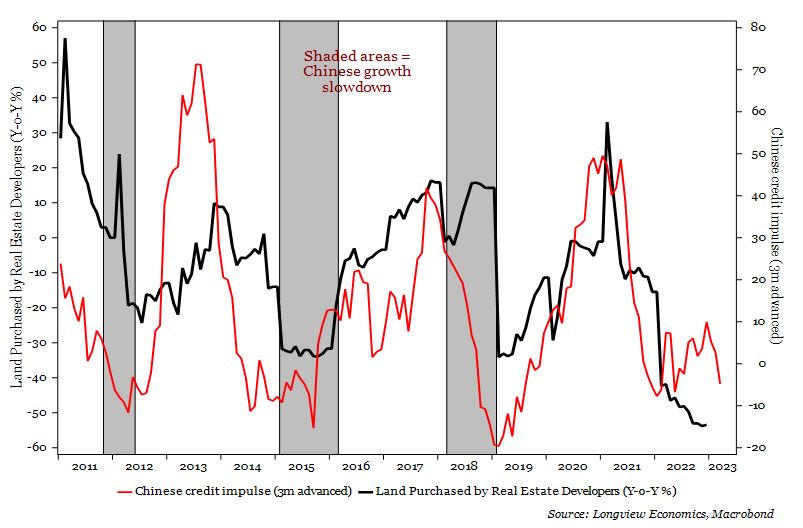
Troublingly in that respect, there is no sign that the early stages of the credit creation process are starting to turn.
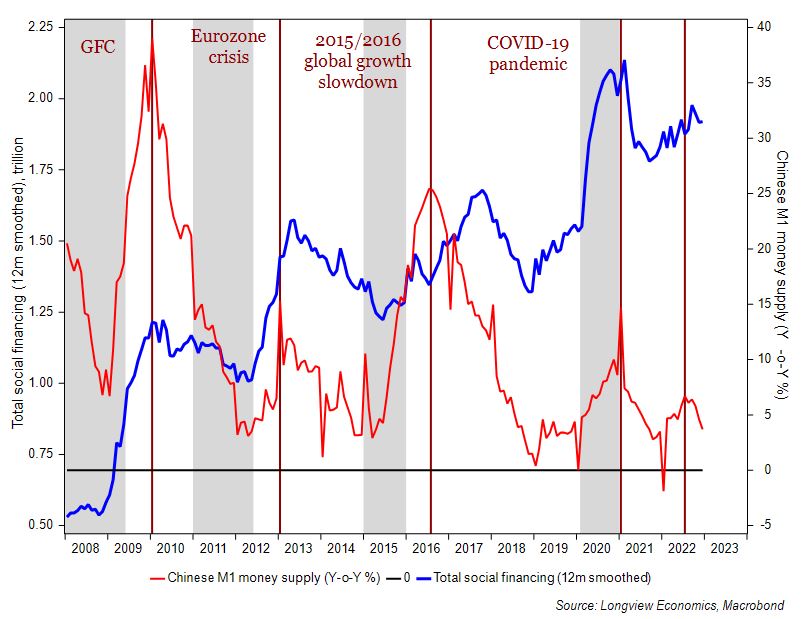
In particular, M1 money supply growth has rolled over in recent months and typically turns ahead of, or coincident with, the turn in credit growth (FIG 3). The key turning points in M1 money growth are shown below with vertical maroon lines.
FIG 3: Chinese M1 money supply (Y-o-Y %) vs. total social financing (12m smoothed)
Furthermore, the PBoC is not significantly loosening policy. Growth in money and credit is therefore unlikely to turn convincingly higher unless the PBoC changes its policy approach.
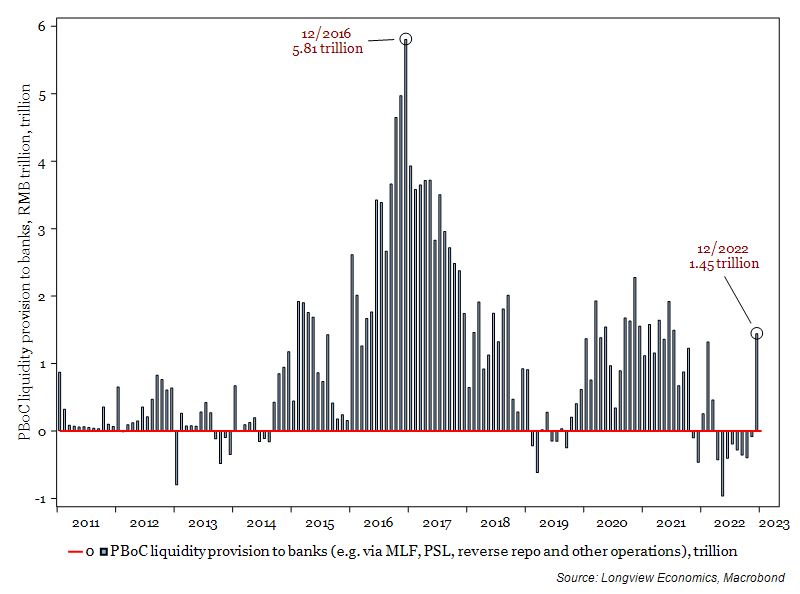
In that respect, some China bulls point to the RMB 1.45 trillion liquidity injection in December (i.e. under MLF, reverse repo, PSL and other programs) as shown in FIG 4.
While that’s the largest liquidity injection in 12 months (about 1.2% of GDP), it’s small compared to the last time the authorities stimulated the economy in 2016, especially given that China’s economy is 70% larger today than it was then. Back in 2016, monthly liquidity injections were regularly between RMB 3 – 5 trillion ( about 5.3% of GDP per month) and, as FIG 3 shows, they triggered a large acceleration in money and credit growth.
Furthermore, there have been no early signs of increasing PBoC support in January. Just ahead of the Lunar New Year holiday, for example, the PBoC’s MLF cash injection was only RMB 79 billion which was less than expected, and small for that time of year.
FIG 4: PBoC monthly liquidity provision to commercial banks (RMB, trillion)
In addition, the PBoC is not meaningfully using its other tools to stimulate the credit cycle. There have only been, for example, 150bps of reserve requirement ratio (RRR) cuts in the past two years. That compares to 300bps of RRR cuts in 2015-16, and 450bps in 2018-19. Interest rate cuts have also been much smaller, with only 65bps of cuts in the prime loan rate since 2019 (vs. 150bps in 2015).
Today, the economy is considerably weaker than it was in those years. The stimulus, though, is notably less.
As such, and with private sector debt doubling as a share of GDP in the past 10 years (to 220%), policy makers appear unwilling to generate another major ‘2016 style’ credit & housing upswing. Therefore, they appear credible when they warn against ‘flood-like’ stimulus as they did when announcing the latest RRR cut.
Or to put another way, loosening covid restrictions is enough to trigger a bounce in activity. Why, then, would the authorities meaningfully stimulate the economy now, when they refused to in the depths of covid lockdowns last summer?
Chinese & Global Inflation
Linked to all of that, the other key question in markets currently is: Will China’s re-opening be inflationary for the world?
Clearly, with commodities re-pricing higher, global inflationary pressure is starting to build. This is most notable in base metals, albeit less so in grains and energy at this stage. With that, there is some concern about the upward pressure on US inflation and the implications for Fed policy.
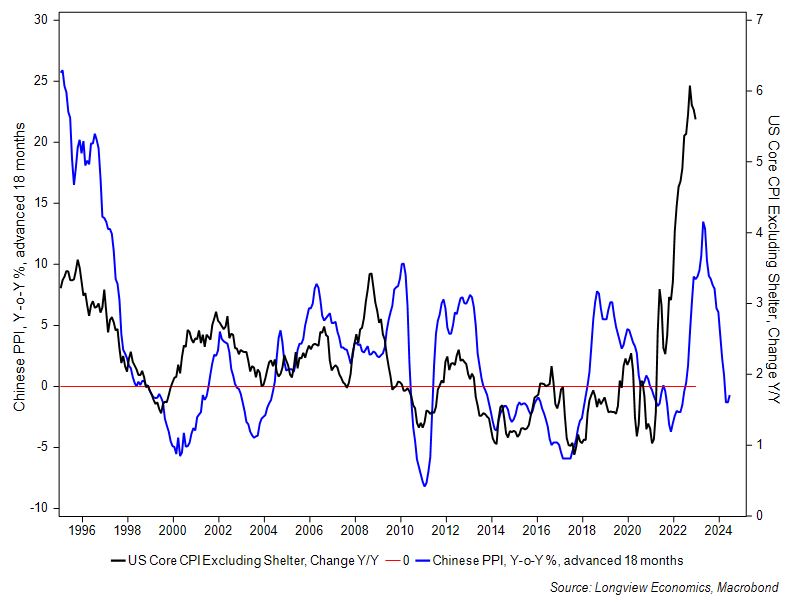
With respect to US CPI inflation readings, though, China’s inflationary and deflationary impulses typically work themselves out on the global economy with long time lags.
Chinese PPI readings, for example, typically lead core US inflation by about 18 months, as shown in FIG 5. The latest data shows PPI readings have collapsed and point to notably lower US inflation. The message from China’s PPI is therefore consistent with a range of other forward looking indicators of US inflation (e.g. the NFIB small business price plans index & ISM prices paid).
FIG 5: Chinese PPI (Y-o-Y, 18 months advanced) vs. US core CPI (Y-o-Y %)
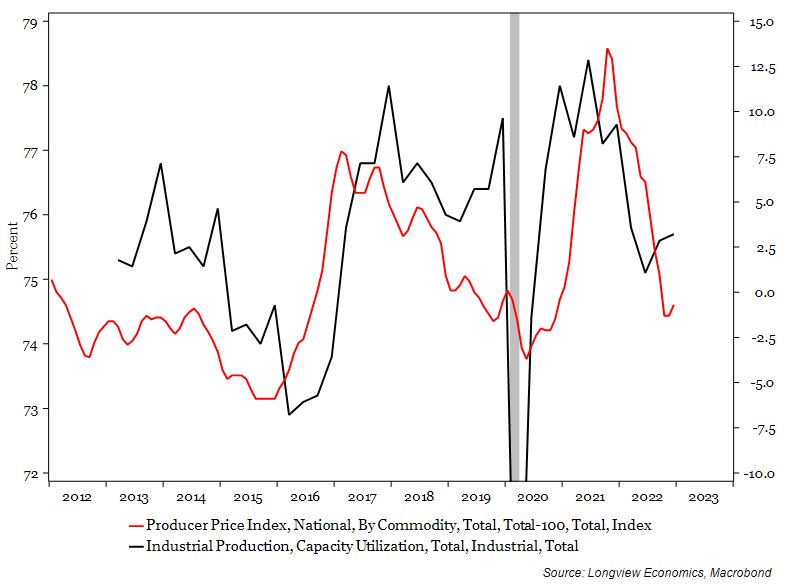
Beyond the next 18 months, capacity utilisation in China’s manufacturing sector should be watched closely. Usually, it’s consistent with the underlying trend in PPI inflation (see FIG 6). In other words, if China’s re-opening results in higher capacity utilisation - which is likely -, then some upward pressure on PPI should emerge this year. As we note above though, the time lags are long.
FIG 6: Chinese producer prices (Y-o-Y %) vs. Industrial capacity utilisation (%)
Current levels of monetary stimulus are not sufficient relative to history, to deliver a strong, long lasting and enduring Chinese housing recovery. In turn, that precludes the likelihood of an enduring economic recovery in China.
Furthermore, whilst the Chinese authorities may choose to enact much greater levels of stimulus in coming months - which is something to watch for -, their recent actions, their desire to limit the amount of further leverage in the economy, and their recent policy pronouncements, suggest that this is not likely. Combined with the global economy – most notably the US – heading towards a recession, China’s export sector will struggle to gain significant traction. So, while a re-opening bounce is to be expected, that bounce seems likely to fade (absent a sharp policy change from the authorities). In that context, the recent strength in Chinese (and other EM) assets, as well as certain commodities, is probably reasonably advanced. This is especially true if there is a US recession in 2023, which is our central view.