
Don’t Let Biases Towards Global Credit Overshadow the Opportunity

Executive Summary
While higher yielding segments of global credit markets can add alpha to diversified investment portfolios, these opportunities are often overlooked by Australian investors as the preference historically has skewed towards traditional asset classes. The most common pushback to investing in global credit markets that we hear is “credit spreads are too tight” or “the risk of default is too high.” By evaluating only spreads and defaults, we believe investors are overlooking sub-asset classes within credit offering higher yields and diversification. Ares focuses on what we view as the more senior, high-quality segments of the corporate debt and alternative credit markets; we call it the “sweet spot” of credit. This encompasses a $6.2 trillion opportunity set across U.S. and European loans, corporate bonds, and alternative credit markets1.
At the start of 2023, despite attractive credit spread and yield levels, recession fears and concerns around increased default risk stopped many market participants from investing in below investment grade credit. Fast forward through year-end and risk assets finished the year on strong footing, outperforming traditional fixed income.
In 2024, while dialogue around corporate default Armageddon has faded amid resilient growth data and progress on disinflation, credit spreads have tightened from last year’s wides. However, all-in yields remain attractive and we believe the combination of higher yields in floating rate loans alongside discounted prices in high yield bonds offers alpha-generating opportunities for active managers, such as Ares.
Alpha in the Sweet Spot of Credit
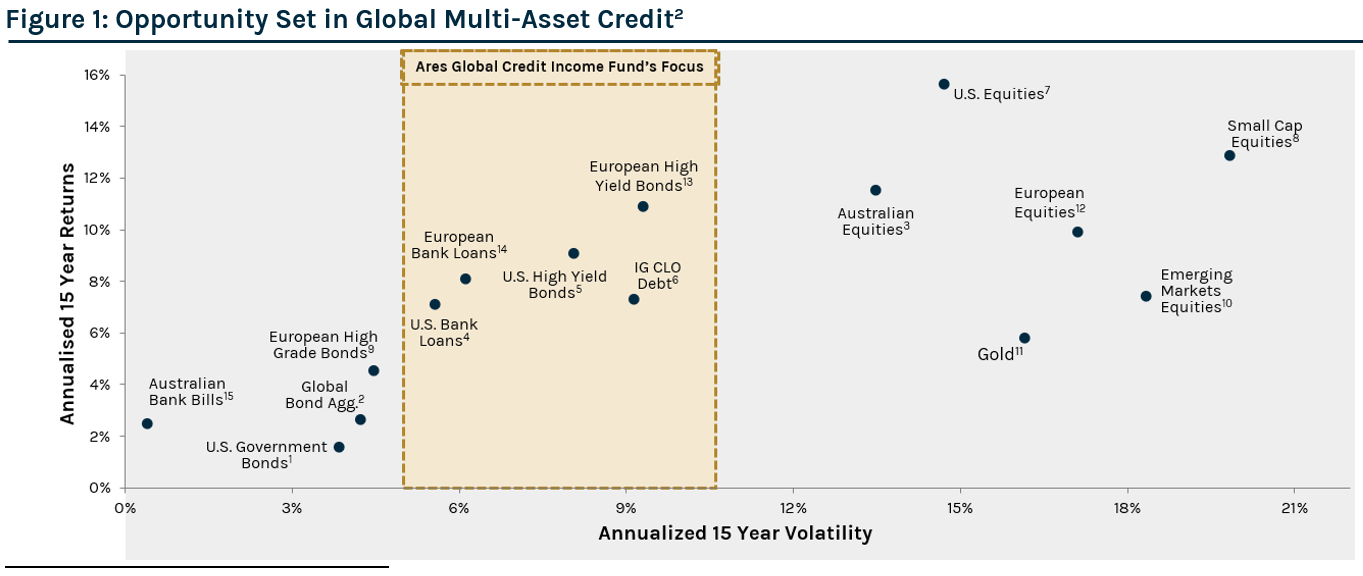
Ares seeks to find the most attractive relative value opportunities in the “sweet spot” of credit to deliver higher yielding investment solutions with optimal downside protection and lower volatility. As illustrated in Figure 1, asset classes in scope achieved similar returns to traditional growth assets, such as equities, with half the price volatility over the 15-year period ending March 31, 2024.
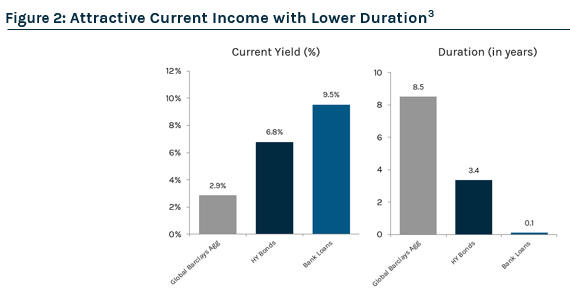
As illustrated by the charts in Figure 2, we believe higher yielding, low duration assets that have complementary qualities can be accessed to efficiently manage exposures throughout cycles, while building a portfolio that provides diversification and yield premium relative to traditional fixed income. While traditional investment solutions have long been viewed as a safe haven for equity price volatility, in today’s new rate regime, low credit risk no longer goes hand-in-hand with low mark-to-market volatility. As we view the main risks underpinning below-investment grade credit to be credit risk and price volatility (not duration or liquidity risk), we believe investors are rewarded for being both disciplined credit selectors and tactical asset allocators.
By investing in the opportunity set outlined above, Ares seeks to construct high quality, income generating portfolios that provide a buffer against choppy price movements and minimize default risk through discerning credit selection and vigilant risk management.
2023 – A Great Year for Floating Rate Senior Secured Credit
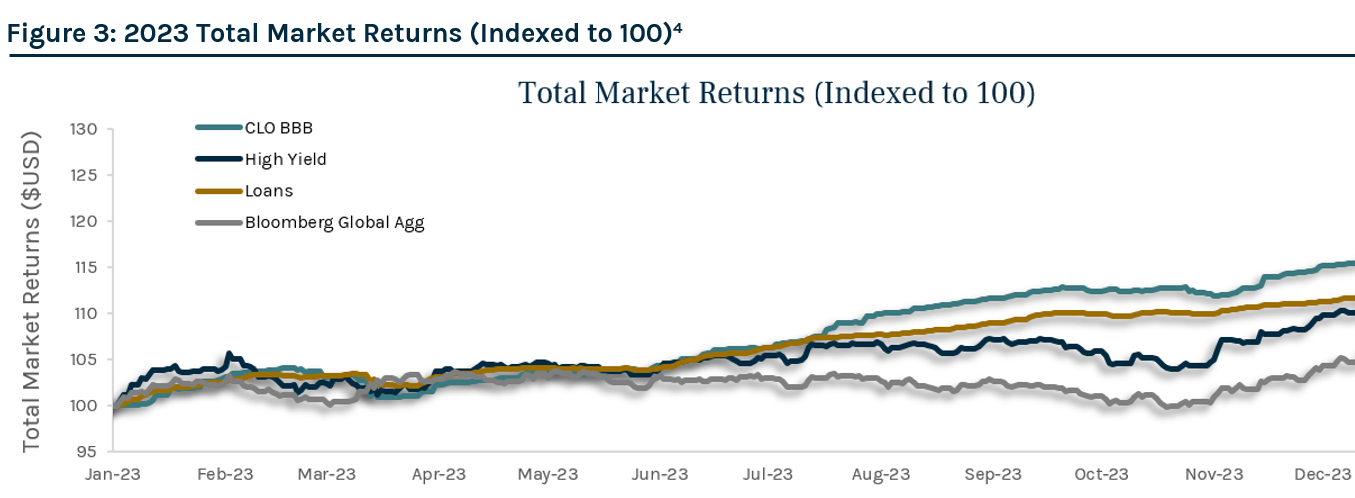
At the start of 2023, we viewed the entry point in leveraged credit to be attractive given the high levels of current yield and potential for spread tightening, particularly in floating rate loans. As shifts in relative value occurred, we capitalized on several opportunities throughout the year to generate alpha within our multi-asset credit portfolios through active asset rotation and disciplined credit selection. We maintained our lower risk and duration posture during the first half of the year given tighter monetary policy and concerns around slowing global growth. After months of de-risking, we moved towards a more neutral risk posture as risk assets stabilized amid better-than-expected corporate earnings and easing banking crisis fears. In the third quarter, we marginally increased fixed rate exposure with the goal of adding convexity to our portfolios as we neared what we believed was the end of the hiking cycle. Importantly, high yield bonds, bank loans, and CLO debt finished the year in a strong position, benefitting from positive macro news and a stronger bid for risk assets in the fourth quarter. As illustrated in Figure 3, performance of our preferred asset classes outperformed traditional fixed income in 2023.
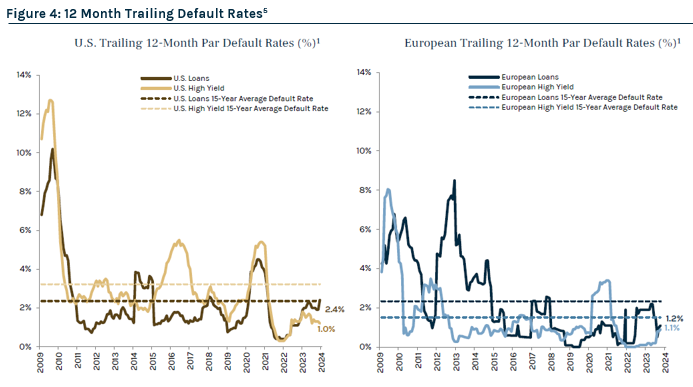
Early in 2023, we were focused on managing a few key tail risks including increased ratings downgrades and heightened volatility given our expectation for slower growth. Although we anticipated high yield bond and bank loan defaults to rise off the lows seen in 2022, we had expected defaults to remain manageable and in line with historical averages. Our default outlook at that time was supported by stable corporate fundamentals due in part to the recent cycle and better issuer balance sheets and liquidity. As many issuers refinanced at attractive levels in 2020 and 2021, most were able to push out near-term maturities and shore up liquidity heading into 2023. Fast forward through today, we saw a modest pick-up in default rates during the last twelve months; however, they remained in the 1-3% context. Specifically, the twelve-month trailing par-weighted U.S. high yield bond and loan default rates have increased to 1.0% and 2.4% as of March 31, 2024, respectively.
Ares seeks to employ superior credit selection through our disciplined investment process that focuses on capital preservation, predicated on bottom-up fundamental research with the goal of minimizing default risk by identifying and avoiding marginal quality credit. This core tenet of Ares’ investment philosophy has resulted in significantly lower defaults relative to the broader market in Ares’ high yield bond and bank loan strategies.
2024 Outlook
Against this backdrop of tighter credit spreads, several market commentators have dismissed leveraged credit yet again. We would counter that sentiment by asking (1) what part of the credit market do you consider when making that statement? and (2) shouldn’t other factors such as credit quality, convexity and yield be considered?
We believe an investor should not only look at spreads when evaluating credit markets and would argue there is a compelling case to be made for certain asset categories within corporate debt and alternative credit markets, which offer potential for 1) strong income from loans, 2) discount opportunity in high yield bonds, and 3) yield pickup and credit enhancement from CLOs.
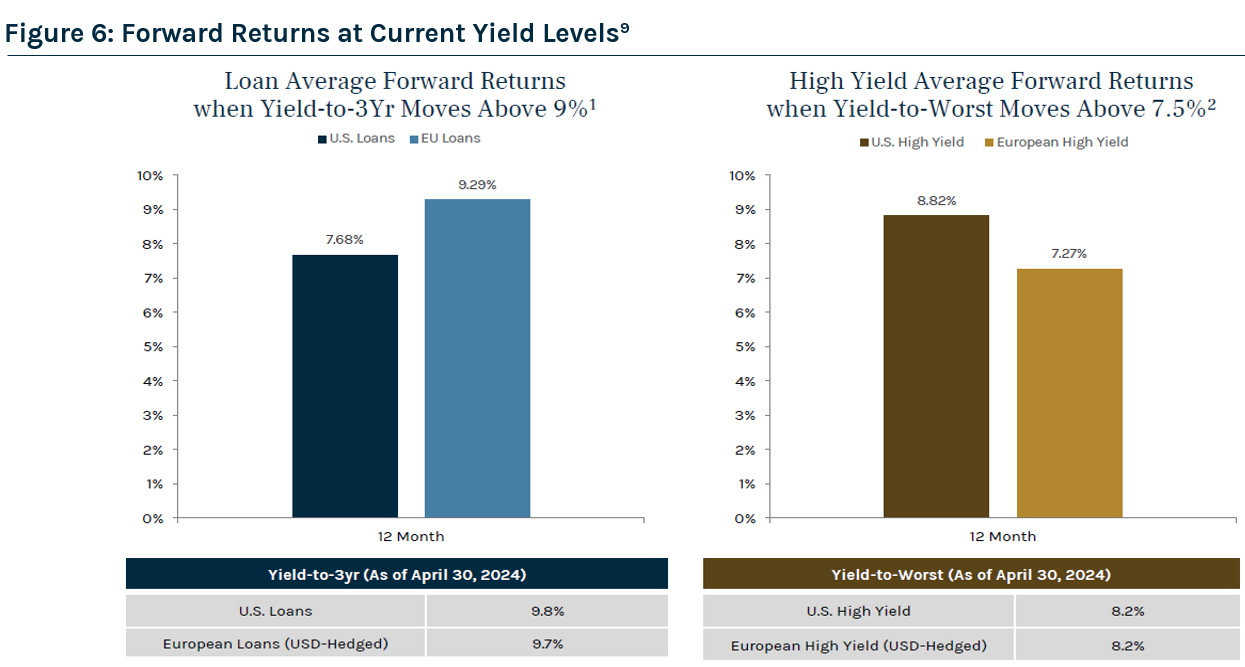
With attractive cash yields in the high single digits, loans continue to provide an attractive forward return opportunity. Notably, current yield levels for U.S. and European loans are greater than 89% and 80% of historical levels for the post-Global Financial Crisis period, respectively. In our multi-asset credit strategies, loans are the core allocation to anchor returns in high levels of current income.
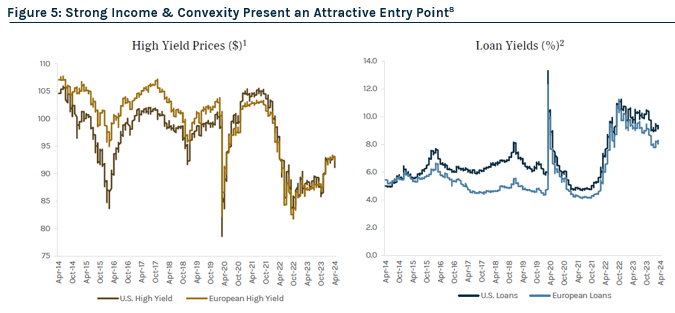
While bond spreads are screening tight, we believe the bond market at current discounted levels is presenting an attractive entry point and alpha-generating opportunity, particularly in the lower rated segment of the market where we’ve seen growing bifurcation. As illustrated in Figure 5, today’s average price of U.S. and European high yield bonds is $91.9 and $92.9, respectively. While we expect income to continue to be the main driver of returns in 2024, it’s worth noting the potential for capital appreciation in bonds - assuming the bond does not default, a bond’s price will benefit from a natural “pull to par” and early take-outs where the bond is repaid at nominal value ahead of maturity. Lastly, we believe CLOs continue to offer attractive relative value compared to loan-only portfolios, similarly rated securitized products and corporate debt given the significant yield pickup. We believe both opportunities in bonds and CLOs are a great complement to our core allocation to loans in our multi-asset credit strategies.
Looking forward, we expect attractive loan and high yield returns over the next 12 months given the starting point from a yield and discount perspective.
Conclusion
Credit spreads and default rates are important metrics to consider when evaluating credit markets; however, taking a single number into account to qualify such a diverse market is likely to lead to missed opportunities. We believe Ares is well-positioned to capture the most attractive relative value opportunities in the “sweet spot” of credit as we seek to deliver enhanced yield with optimal downside protection and lower volatility. Our differentiated approach to capitalizing on the best risk-adjusted return opportunities across the investable universe is rooted in the scale and integration of our Global Liquid and Alternative Credit strategies, which allows us to fully leverage extensive research and origination capabilities, proprietary technologies and longstanding relationships across the platform.
In closing, in today’s “higher for longer” interest rate environment, we believe flexible investment solutions anchored in higher yielding segments of the corporate and alternative credit markets are poised to benefit from the attractive forward return potential while fundamentals remain stable, and the technical backdrop remains supportive.
Please see full article for Index Disclosure and Definitions.