
Increased Market Volatility – Continuous Disclosure or Liquidity?

The AFR wrote an opinion piece on 3 March 2024 noting that the corporate reporting season was not the sleepy affair it once was1. They noted, using the 20% positive and negative share price reaction of Reece and Corporate Travel Management (Corporate Travel) respectively as examples, that the days of subtly guiding the market to a safe low volatility consensus appear to be over. We would subsequently add that in both cases that as at the end of March the share price trajectory is still intact. Reece is still trading at around $28 per share*, the price it shot up to on its 27 February 2024 interim result day. Similarly Corporate Travel is currently trading at just below $17 per share, down just over 15%*.
The AFR noted that in their opinion Reece tended to be less willing to constantly update the market while Corporate Travel was more inclined to provide incremental updates between formal semi-annual reporting dates. They then noted that neither approach seemed to have achieved the lower volatility outcome perhaps desired by the requirement for continuous disclosure (in this instance). The ongoing refinement of Factset, Bloomberg or Visible Alpha consensus data, that is available to anybody who is prepared to pay for it should (other things being equal) also make it easier to minimise result day volatility.
REH, CTD ASX: Corporate Travel and Reece trip up traders in wild reporting season (afr.com)1
The Australian also wrote an article on 8 March 2024 titled “What’s to blame for corporate shocks this reporting season”2.
As a small and mid-cap manager we are not as familiar with the ASX top 50 stocks mentioned in this article other than to note that we believe that ASX 50 stocks tend to be less volatile than small and mid-caps. This article refers to 17% decline in the result day share price of Lend Lease which appears to us to be small cap like in its quantum.
What’s to blame for corporate shocks this reporting season | The Australian2
Top-down numbers
An analysis of the recent S&P ASX Small Industrials Index over the February 2024 reporting season indicates that the size of forecast Earnings Per Share (EPS) revisions has reverted to pre-COVID levels.
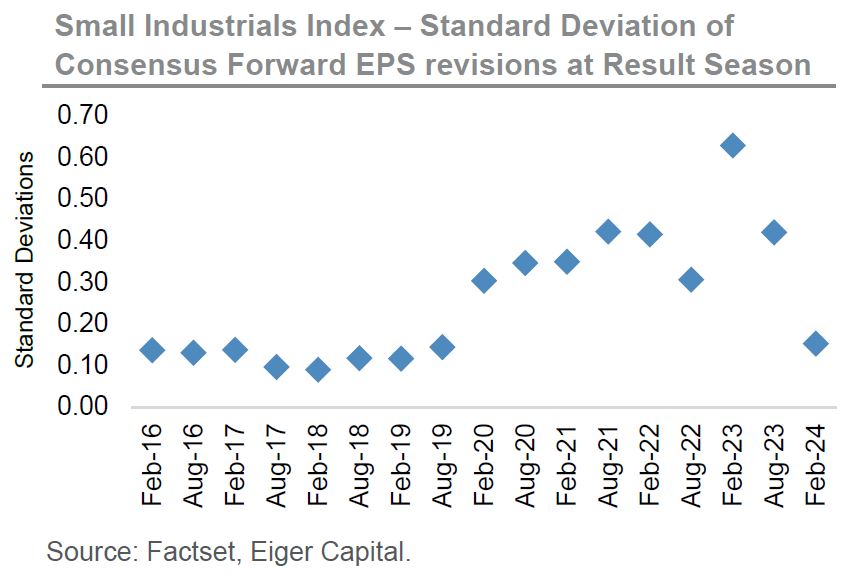
The standard deviation of EPS revisions in February 2024 was in line with the period from February 2016 to August 2019. By February 2020 COVID had already become widespread in China, Italy and Iran and was beginning to rapidly spread. From mid-February 2020 to the end of that month the ASX 200 fell just over 9% having risen slightly in the first half of that month. The reporting periods from August 2020 to August 2023 have seen elevated EPS revisions as economic activity was very unevenly distributed with some sectors being significant winners (e.g. home delivery and home furnishings) and some significant losers (e.g. travel). During the COVID reopening period from early to mid-2022 there have still been significant variations in earnings outcomes as global supply chains have struggled to normalise and energy prices were disrupted by the start of the Russia-Ukraine war.
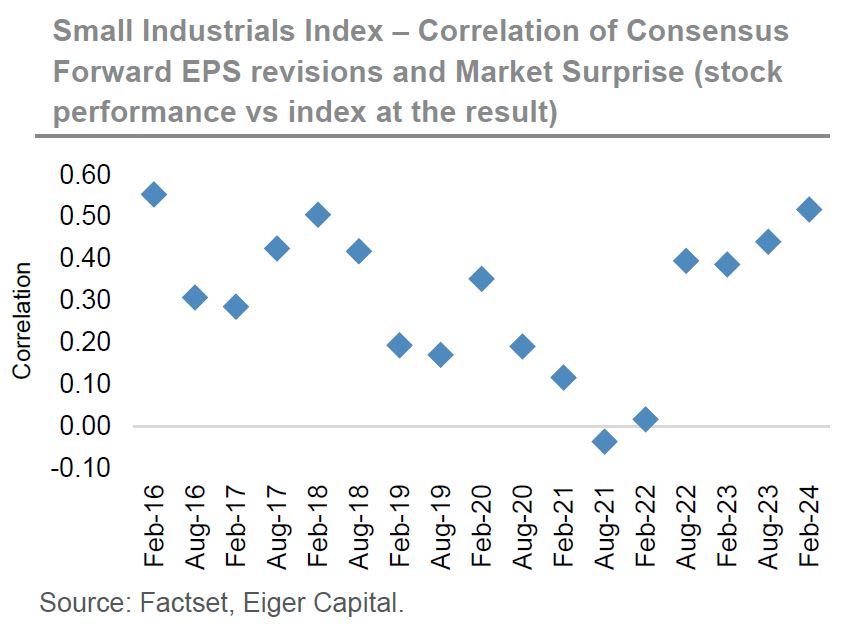
In addition to the declining variance of EPS revisions across the Small Industrials index in February 2024, the correlation (strength) of positive and negative revisions to the share price increased. This reverted back to the top end of the correlation range witnessed prior to the onset of COVID.
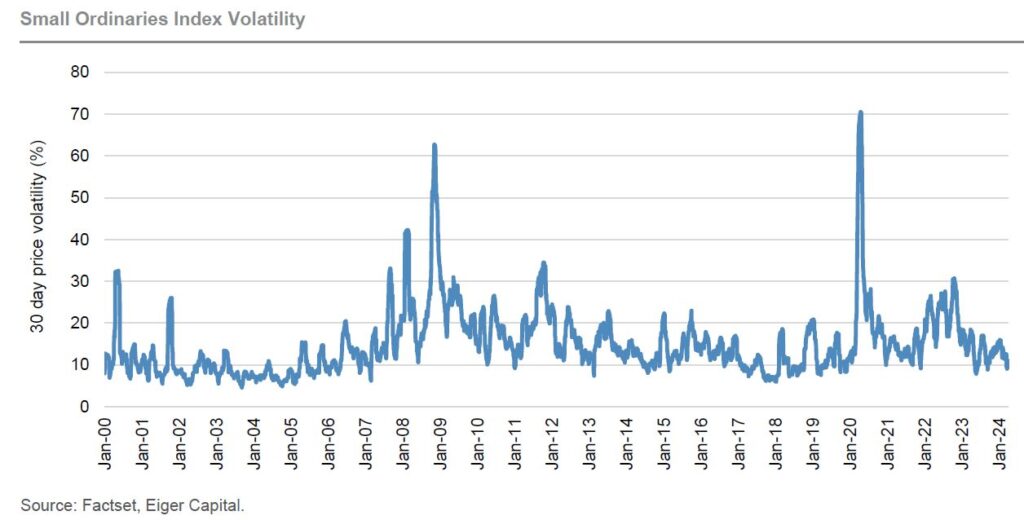
Finally at the Small Ordinaries index level volatility remains low and at pre-COVID levels. The following chart highlights that the two significant spikes in index volatility were in 2008-2009 (Global Financial Crisis) and 2020-2021 (COVID).
Bottom-up Numbers
The analysis above suggests that the variability of earnings revisions has fallen, share price reactions are at least in the expected direction given an upward or downward earnings revision and the overall volatility of the Small Ordinaries Index remains at low levels. Does it therefore follow that, as noted in the business press, that the February reporting season was anything but a dull affair that was in line with historic norms?
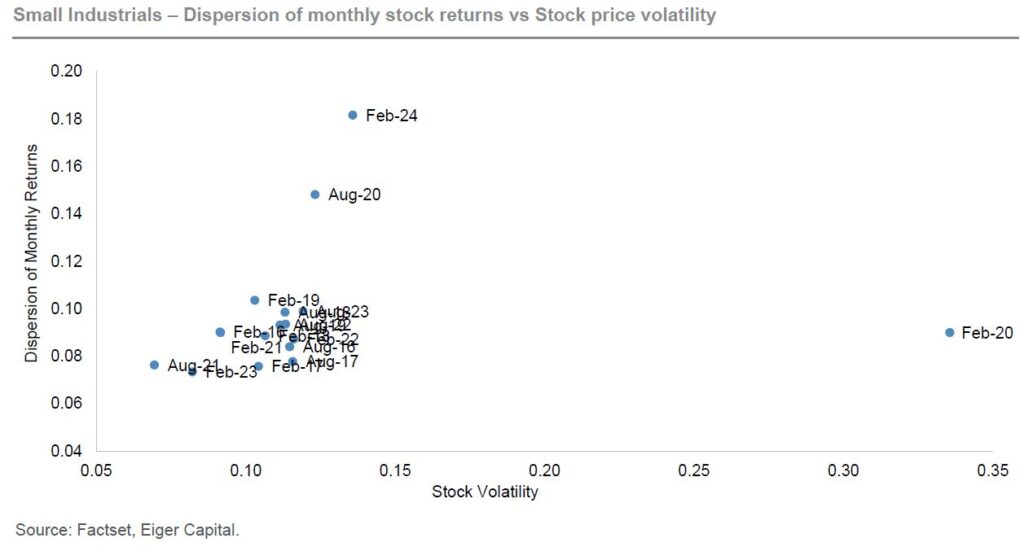
In attempting to look at this further we have compared the variability of monthly stock returns with the dispersion of the intra-month share price high and low. The x-axis on the chart below takes the individual stock return over the relevant month and calculates its variability. So, for example the variability of stock price returns in February 2020 was extreme. There was a very large spread of high and low returns that month. By comparison the variability of returns in February 2024 was lower and more in line with the upper end of the normal range. The reporting period with the lowest variability of monthly reporting season stock returns in our survey was August 2021.
So individual stock returns in the month of February 2024 were not outside historic ranges. However the story does not end there. The y-axis measures what happened within the month to individual stock prices. This axis takes the intra-month high and low for an individual stock and measures the size of that dispersion. By contrast this was by far the highest recorded in our survey.
Let’s take Corporate Travel. It saw downward EPS revisions and the stock traded down. Reece, mentioned above, was exactly the reverse. In both these cases the share prices reacted negatively and positively respectively and stayed that way over the month. These stocks will have been significant contributors to share price return volatility (x-axis) and high share price dispersion (y-axis). However, the normal level of stock return volatility in February 2024 combined with an extreme measure of stock share price dispersion suggests there are many more stocks that went in one direction significantly and then reversed by month-end.
The data indicated that February 2024 was typified by stocks such as Pro medicus and Breville. Pro medicus, at the time the largest stock in the Small Ordinaries (now in the ASX 100), started February 2024 at just over $101.56 per share. It finished the month at $103.82. Volatility of monthly return was low at just over 2%. However, the high-low for the month, centered around the interim result update was $111.35 (pre-result) to $87.24 (post result). The low is almost 22% below the high. Breville is similar. Breville started February 2024 at $27.34 and ended the month at $27.33. So, a 1c difference! However, the share price high for the month was $27.46 and the low was $24.92 or 10% below the high.
Liquidity?
There is a view, detailed above, that there could be an overall decline in continuous disclosure. This is despite a steady increase in the availability of consensus data and a steady increase in the level of detail notably by the now widespread use in Australia of Visible Alpha. This is backed up by noting that the size of EPS revisions and their immediate impact on share price reactions appears to have returned to pre-COVID levels. Overall index volatility remains within normal levels and certainly nowhere near GFC or COVID levels.
Overall start to finish monthly return volatility is also normal but intra-month volatility increased materially in February 2024 to levels not seen in our analysis period.
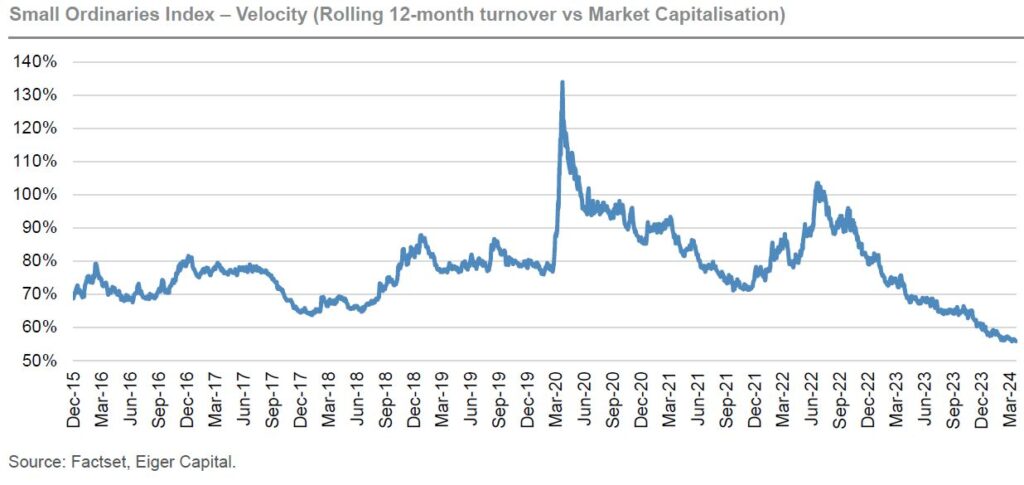
The following chart highlights the rolling 12-month liquidity of the Small Ordinaries index. Once again, we can see the significant spikes caused by COVID as portfolios were repositioned at the start and toward the end of the pandemic.
What appears to be the case though is that the velocity of turnover relative to the size of the index is at historic low levels. We consider that this is a rolling 12-month chart, and it implies that liquidity in recent months is even lower.
What could be the cause of this? One possible explanation is the lack of IPOs in the last few years. There is little doubt IPOs increase overall liquidity for a short period of time but in our experience, this normalises within a week at most. Takeover activity similarly, briefly, increases liquidity significantly on the day a bid is announced. There can also be significant periods of liquidity in a takeover as shares swap hands between long term investors and shorter-term takeover specialists. The downside of a takeover is that ultimately it may reduce the size of an index leading to less opportunities for long term investors.
We believe a factor worth considering is the impact of passive and near passive investment management. It is difficult to accurately measure the exact amount of passive investment within the Small Ordinaries index. An analysis of the largest small cap company, Paladin Energy (excluding CSR which is under takeover), yields the following: global ETFs and index funds that do not necessarily trade on daily fundamental news appear to own around 20%. This is based on the information available in Factset. In addition to this investment, we believe there could also be holdings by wholesale passive funds who manage money on behalf of institutional holders either internally or externally. There are also strategic holdings in some companies, notably those that are very long duration and infrastructure-like that do not participate in market liquidity. Paladin Energy does not have a strategic shareholder of this type so on this basis a maximum of 80% of Paladin Energy can be traded based on news flow and this number could easily be significantly lower. NextDC, which does have visible strategic shareholders, appears to have close to 30% of its register held by long term and passive investors.
Using the velocity of trading chart below, if we exclude the COVID period, has fallen from around 70% to 56%. We do not think that it is implausible that the bulk of this decline is the accumulation of passive and near passive investment styles. This factor is likely to have impacted large cap indices earlier than small cap benchmarks as constantly re-balancing passive funds ironically is easier with more liquidity.
In addition to reduced liquidity, that could be due to increased passive or other factors, we would note that we witness daily the impact of larger systematic investment managers. A systematic manager has a set style, often enhanced by algorithms that will trade with minimal human intervention. This style could well be a factor in increasing intra-month volatility as the immediate reaction to news flow in often substantial.
Explaining the Vibe
We believe that what the business reporters are witnessing isn’t a breakdown in continuous disclosure but rather increased share price reactions to news based on the evolution of investment styles. Liquidity is currently at a low level and concurrently we believe that execution of large orders by systematic investors has become more aggressive.
Will liquidity continue to structurally decline, and will short term volatility continue to increase? We aren’t sure but either way it doesn’t concern us as we plan to maintain a level of funds under management that will allow us the flexibility to execute our investment style. To some degree it may provide additional opportunities particularly if stocks continue to move aggressively and then rebound intra month.
*As at the date of this article.
1. “Corporate Travel and Reece trip up traders in wild reporting season”, Australian Financial Review, 3 March 2024. May require paid access to view full article.
2.”What’s to blame for corporate shocks this reporting season”, The Australian, 8 March 2024. May require paid access to view full article.
Author: Stephen Wood, Eiger Capital Principal and Portfolio Manager
This material has been prepared by Eiger Capital Limited ABN 72 631 838 607 AFSL 516 751 (Eiger Capital). It is general information only and is not intended to provide you with financial advice or take into account your objectives, financial situation or needs. To the extent permitted by law, no liability is accepted for any loss or damage as a result of any reliance on this information. Any projections are based on assumptions which we believe are reasonable but are subject to change and should not be relied upon. Past performance is not a reliable indicator of future performance. Neither any particular rate of return nor capital invested are guaranteed.