
Office, Will the Brave Be Rewarded?
Office, will the brave be rewarded?
The commercial office sector has certainly been a topical theme of late. Do recent trends represent long term structural changes or a short-term cyclical challenge that we’ve seen before? Commercial property specialists, Elanor Investors Group, looked to answer this question for investors in its inaugural quarterly real estate thematic update.
Since the onset of the global pandemic, work from home (WFH) has been seen as a major structural challenge affecting the commercial property sector. But what is actually happening on the ground is distinctively different to the headlines you read in the newspapers.
Over the last two decades there has been a number of times where the death of the modern office has been called, but it has never eventuated. At one point, not too long ago, it was offshoring of local jobs that was considered a threat to office space. Then there was the thematic of densification where we were going to have more people working in smaller spaces. And, of course, the role of new technologies in making machines more effective than people. WFH represents just the latest in this ever-growing list.
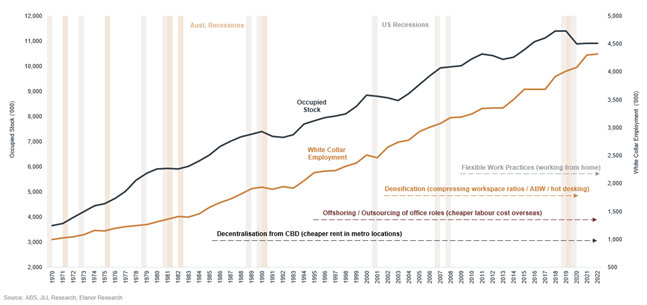
But in looking at 50 years of total occupied stock data – (the total amount of accommodation leased) – office demand has only really pulled back at times of economic slowdowns, with the trend line rising in line with population growth and increased levels of white collar employment over time.
Sydney, Melbourne & Brisbane CBD Total Occupied Stock vs White Collar Employment
There are a number of reasons why we strongly believe WFH is not the structural headwind that many are forecasting.
Firstly, looking at data on workers returning to the office, it has tended to stabilise at the 70-75%. Although, it is certainly the case that not all markets are the same. For example, return to work levels in Perth (91%) and Adelaide (85%) are relatively high compared to Melbourne, Australia’s most locked-down city during COVID-19, which is lagging at 56%.
Secondly, in diving into the data, total occupied stock in prime grade commercial property across all CBD’s is actually at a higher level now than it was pre-COVID. That means the number of square metres leased is now higher than before the global pandemic across most capital cities So while there may be less people in the office, it has not impacted demand.
Thirdly, office rents continue to grow. This is textbook supply and demand economics. While the rate of growth in demand in the CBDs may have slowed a little over the last few decades, it has been matched by a slowing in the supply delivery which has adjusted to meet the slightly lower growth rates in demand. And the fact that the supply has adjusted in response to slowing demand. The result, vacancy levels have consistently remained around an equilibrium vacancy rate of about 8%.
All this is showing us from a demand perspective is that we don’t see the WFH trend having a major impact that will permanently reduce demand for office space.
Where are we in the cycle
If the changes we are seeing are not structural then the question becomes where are we in the current cycle?
Our analysis shows that there is a high correlation between the office market cycle – or more precisely the cap rate cycle - and the inversion of the US yield curve.
What we see in our experience is that during each cap rate softening cycle, we've tended to have inflation spiking and ten-year bond yields increasing.
What we can see today is, although we've still got the cap rate softening, we can see that inflation appears to have peaked now and, while not certain, ten-year bond yields are also peaking, and historically these are two preconditions that indicate we’re towards the end of a cap rate softening cycle.
Relationship of Cap Rate Softening Cycles with Inflation and 10 Year Bond Yields
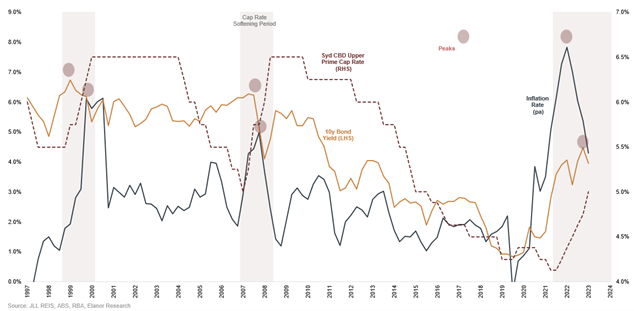
To take this one step further, we looked at 50 years of data of previous cap rate cycles using Sydney CBD as a case in point. This shows there seems to be a very similar duration for the softening cap rate cycle, which tends to last approximately two years. What we also see during these softening cycles is the cap rate, on average, softens 30% - we’re currently at 21%.
What does all this mean? In our view, we believe we are currently tracking to the same trajectory of prior cycles. In other words, while we still have a little way to go, we believe we are 18 months through a two-year cap rate softening cycle based on those indicators and the historical data.
We are emerging into a zone where prime commercial office is becoming an attractive buying proposition; and that is certainly what we have heard over recent weeks from institutional buyers from across the region. Australian office is very much back on the radar.
What makes this exciting for investors, is what happens when we emerge from this cycle. Based on past experience, the average 5-year return following a softening cycle is 10-13% p.a. when buying just after the peak.
However, as always, while we can learn from the past, every cycle is different. The nuance we see being different in this cycle is actually a favourable tail wind – very low office supply across the country. Rising construction costs, increased interest rates and the softening cap rate has made it difficult to make new office developments viable and so we are now seeing this impact both current and future supply looking ahead through to 2027.
WFH is no doubt a major change for employees, employers and the office sector. But we’ve seen many similar challenges over many decades. We expect to see in the next couple of years strengthening demand meeting with limited supply, fueling the next wave of rental growth and delivering strong total returns to commercial office investors over the next few years.
Australia’s east coast office markets at a glance
In prime commercial real estate no two markets are the same – and we often find sub markets within markets. It is a critical point for investors to understand and it is where our insight, in managing $2.5bn in commercial property across every major capital city in Australia, is critical. Here’s a look at the current state of Australia’s key eastern states capital cities:
Melbourne is a city that will take longer to recover, with the return to office significantly lagging other states.
Brisbane has had a relatively fast recovery from COVID and has the economic fundamentals, in terms of net migration, increased government infrastructure spend, and the 2032 Olympics, that bode well for demand to rise strongly, especially for high amenity office space.
Sydney is a tale of two cities. We've got the northeast corner or the CBD core that is performing exceptionally strong and with the western corridor slightly lagging behind. But even that seems to be changing since the start of this year.
For further information
Subscribe today to hear Elanor’s real estate insights at their quarterly real estate thematic update by emailing capitalmarkets@fidante.com.au. Fidante is Elanor’s exclusive distribution partner and member of the Challenger Group.