
Private Debt Dominance

Private Market Insights
Based on recent headlines, it seems the financial news media has finally picked up on private credit. Private credit’s allure, quite simply, is its return for-risk profile. In today’s markets, it has one of the
highest Sharpe ratios, particularly when compared to other liquid credit alternatives.
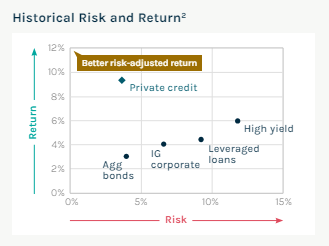
Current returns1,2 are in the low double digits (~10–12%) with lower risk—as defined either by volatility (~5%) or loss rates (~1%)—than more liquid bank loans and high-yield bonds, which have volatility of 9–12% and loss rates of 1.0–1.5%).
Drawn in by these fundamentals, many advisors have begun investing in private credit and been rewarded with an experience consistent with history: yields 200–400bps higher than public debt, with lower volatility.2
Others have been more skeptical. “Too good to be true” is a phrase we hear a lot.
While awareness of these investment results is growing, there remains a lack of understanding of what truly drives them. With this paper, we help fill that knowledge gap by answering the following question:
What drives private credit’s historically attractive yield and lower risk, and is it sustainable?
-
Based on index information below.
-
All data as of 9/30/2004 – 3/31/2023. “Private credit” is represented by the CDLI Index. “Leveraged loans” is represented by Credit Suisse Leveraged Loan Index. “Agg bonds” is represented by Bloomberg Barclays US Agg Total Return Index. “IG corporate” is represented by Bloomberg U.S. Corporate Bond Index. “High yield” is represented by Bloomberg Barclays U.S. Corporate HY Bond Index.