
Small is Beautiful
Eiger Capital
Author: David Haddad, Principal and Portfolio Manager
As we summarized in our September quarter note, there was a time post the Fukushima disaster when it appeared that nuclear energy was too risky and would be bypassed entirely in favour of renewables. Coal was to be phased out and wind and solar, as well as more marginal technologies like biomass, would increasingly play a central role in keeping the lights on. Zero carbon will eventually disrupt the transition fuels too (a polite term for gas) so that come 2050, the energy transition will be complete.
This is a neat narrative but it’s looking increasingly likely that the scale of the transition may just be too great to reach net zero in less than 30 years. After all, the global population continues to grow and there is a very strong correlation between population size and energy demand – we all require energy for life’s basics and per capita consumption continues to rise. The inequalities of energy consumption apparently don’t matter; wealthy countries with low population growth consume far more power per capita than poorer ones. We can either try to grow a bigger pie, or be fairer with the one we have, and if it’s a bigger pie we need, then the scale of transition is extremely daunting.
Excessive demand can lead to many problems, and we will need to walk a fine line between environmental preservation and deprivation. The Australian Broadcasting Corporation recently featured an article entitled, “How can we support the transitions to renewables without further damaging the environment?”, which highlighted the ‘dark side’ of the rush to electrification – pollution and degradation.
An example is the controversy surrounding the Upper Burdekin Wind Farm in Queensland. Windlab, a company associated with Andrew Forrest and at one time had the support of Apple, has been criticized for the scale of land clearing and endangerment of several threatened species including koalas and rock wallabies. It’s an odd circularity akin to that infamous line from the Vietnam War era, “we had to destroy that village in order to save it”.
Where does nuclear fit in? Besides being a low-carbon source of power, it offers several other advantages over most other renewables: long life; high reliability/efficiency; competitive life-time cost; less intensive use of raw materials; and lower physical footprint. In this piece, we focus on the small footprint that nuclear power generates relative to other power sources. Coal has been a foundation for modern economies, providing ‘safe’, stable baseload power. Nuclear has the same ability and can do so in a uniquely small area for its potential.
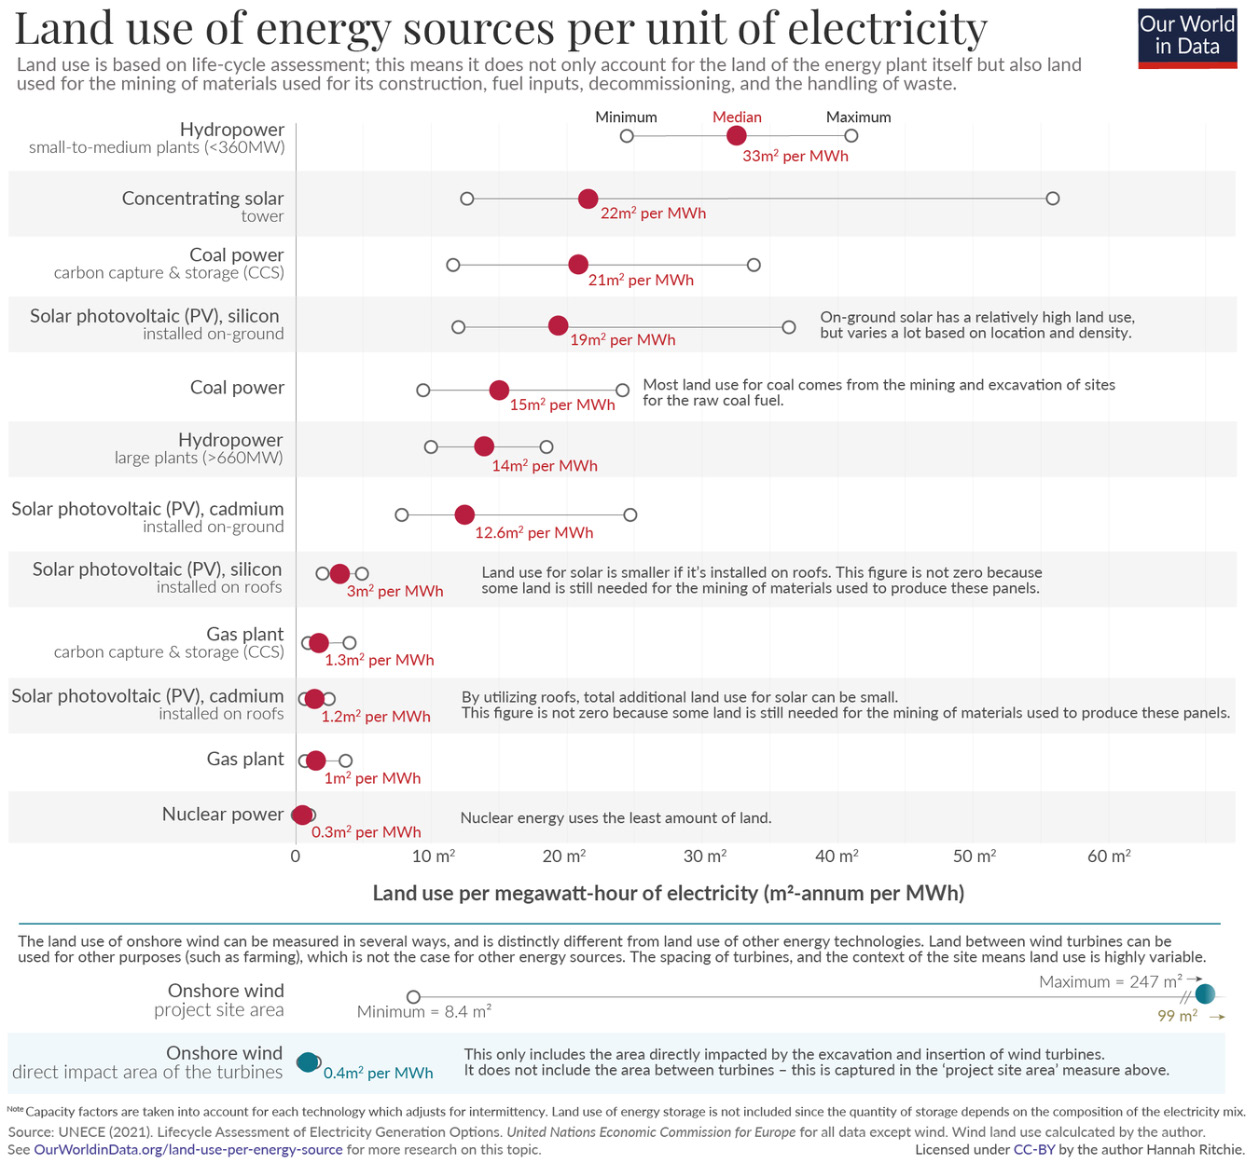
In an article published on OurWorldInData.org in 2022, author Hannah Ritchie detailed the relative land use intensity of different methods of power generation.1 The lifecycle assessment, i.e., complete land use including mining, found that nuclear power at 0.3m2/MWh is the most efficient form of power, including renewables (Figure 1).
Onshore wind is almost as efficient at 0.4m2/MWh if only the land used by the windmill is counted and not the entire wind farm. This is because land in between windmills can have other uses, such as agricultural production or grazing. The total area needed can be very large and may require the clearing of vegetation, hence the large range. As the Burdekin project shows, this can disturb the natural state of a large area although it would be hard to argue that the land is completely sterilised.
As turbines grow in size and technology advances, there is likely to be some improvement in m2/MWh though vary through a wide range.
Figure 1: Relative efficiency of power generation relative to land use
Offshore wind offers several advantages over onshore installations, namely an ability to install larger and more efficient turbines, and land use ceases to be an issue (ex the need for raw materials). The limiting factors for offshore wind tend to centre on finding suitable wind resources, seabed condition, locations near population centres, visual impacts, access to fisheries and impediments to marine navigation and aircraft. There has been some controversy regarding the potential impact on whales, and while this issue has recently been a hot topic in the US, to date there is no evidence that connects offshore wind farms to the injury or death of whales.
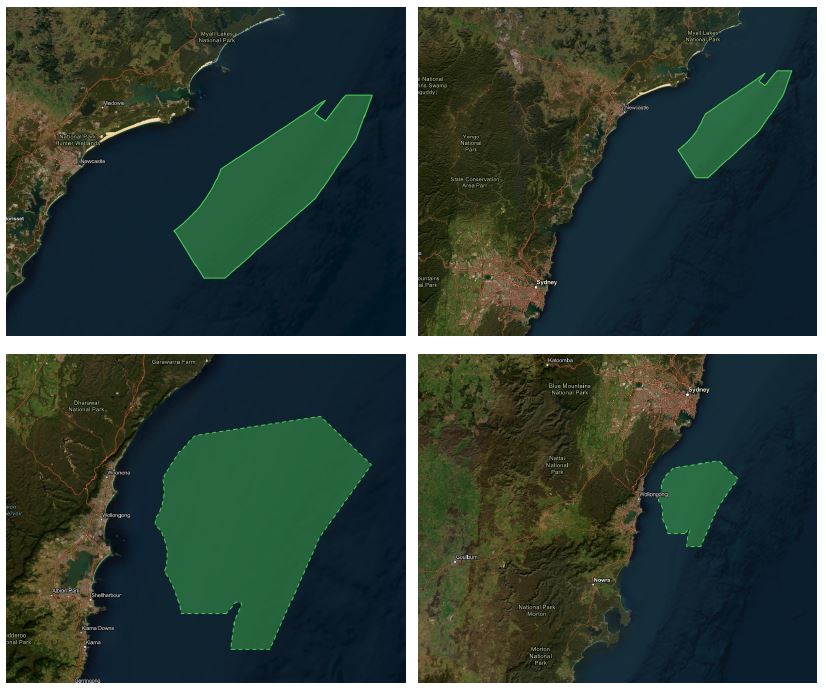
Nevertheless, these utilities are enormous, sprawling structures, where for example, the proposed Illawarra (4.2GW) and Hunter (5GW) projects offshore NSW cover areas of 1,461km2 and 1,854km2, respectively (Department of Climate Change, Energy, the Environment & Water, DCCEEW). To give some context, that is roughly the same size as Fraser Island (K’gari), the world’s largest sand island. Another way to look at the scale is to consider that the Illawarra project would stretch over about 50km of the coast and the Hunter up to 90km, or a combined 6.5% of the state’s coastline (Figure 2). The windmills themselves will be around 270m high and at 15MW each, around 600 would be needed to meet the stated capacity of the combined area.
Figure 2: Proposed area for the Hunter (top) Illawarra (bottom) offshore wind projects
Solar PV’s great advantage is that for the most part, it uses existing infrastructure (rooftops). The Australian PV Institute states that there are over 3.6m PV installations in Australia totalling more than 32.9GW of capacity with most systems between 6.5kW and 9.5kW, i.e., suburban roof tops. Our basic analysis indicates that the area used by all PV solar in the country is only about 146km2 and 2m2/MWh assuming a somewhat generous average of 400W panels and no secondary impacts from mining. On a life-cycle basis, Ritchie estimates that number to be 3m2/MWh for rooftops but 19m2/MWh for on-ground commercial facilities.
On-ground commercial solar arrays don’t piggyback on existing structures, so their land-use is real. Hence, they are amongst the least efficient forms of power generation in terms of their footprint. The largest proposed solar PV facility in Australia is Sun Cable in the Northern Territory. At 20GW, it would cover 120km2, almost as much area as all other PV installations in Australia, but be located on pastural leases used to graze cattle. Large as it is, Sun Cable is remote and is almost meaningless in a country the size of Australia.
The area of installed solar PV in Australia is just one-tenth that of the Illawarra wind project yet has almost 8 times the installed capacity. Naturally there are other things to consider, such as the higher capacity factor of offshore wind (e.g., ability to generate at night) that make installed capacity an overly simplistic measure. Using average global capacity factors for offshore wind of 40% (35-45% range over 2010-2022) and 12% for rooftop solar in Australia (i.e., non-commercial), solar PV would still have 2 times the capacity of the Illawarra project – 4GW vs 2GW – for the same operational life.
At the other end of the spectrum are hydro systems, mainly due to the mining footprint and the flooding of valleys for water storage. A slightly unusual system is solar that uses mirrors to concentrate solar energy on a tower to create heat. Land use is very intense, averaging 22m2/MWh, which suggest that these systems are somewhat extravagant and that better alternatives exist.
Nuclear suffers from very few of the problems discussed above. Firstly, the raw size of the nuclear power plant itself is relatively small and the move to Small Modular Reactors should enhance this feature. A 1GW nuclear power plant covers approximately 3.5km2 while a coal plant of the same size is almost twice that. Neither can compete with gas, however, at 0.5km2. Pity about the CO2. There is a case to make that the sites of shuttered coal-fired power plants would make good sites for new nuclear ones in that grid infrastructure is in place and further land clearing is unnecessary.
Secondly, the mining of uranium does not take much space relative to the output of a nuclear power plant and hence m2/MWh is miniscule. Land disturbance for coal mining is famously large and ash disposal contributes to land use. The scale of coal consumption depends on plant design, efficiency and the rated calorific value of the target fuel, so there is no rule of thumb. However, the World Coal Institute estimates that at 38% efficiency and 75% availability, a 1GW coal plant would burn 2.5Mtpa bituminous coal and 6.5Mtpa brown coal. Compare this to a nuclear power plant of the same size, which uses about 27tpa uranium, requiring perhaps 0.5Mlbs U308 and ore input of maybe 400ktpa depending on grade and recovery. Mining for silica, aluminium, copper and zinc contribute negatively to solar and wind.
Thirdly, nuclear power plants are highly efficient, with plant availability of more than 90% over long life spans. These are key factors in life cycle analysis because they result in nuclear power plants producing many more TWh of power over time than other power plants, i.e., a bigger denominator.
All this is underscored by the COP28 meeting held in the UAE at beginning of December, which again highlighted the role nuclear power could play in the drive to decarbonize. More than 20 countries signed a declaration to triple nuclear capacity by 2050. It included major economies such as the US, Japan, South Korea, France and the UK, though not Germany (nor Australia for that matter). This represents a stunning turnaround for the nuclear industry and is reflected in the surging uranium spot price, which is now US$87/lb. We continue to believe that nuclear energy will play an increasingly important role in providing the world with clean power and maintain significant positions in near-term uranium producers, Boss Energy and Paladin Energy.
This material has been prepared by Eiger Capital Limited ABN 72 631 838 607 AFSL 516 751 (Eiger Capital). It is general information only and is not intended to provide you with financial advice or take into account your objectives, financial situation or needs. To the extent permitted by law, no liability is accepted for any loss or damage as a result of any reliance on this information. Any projections are based on assumptions which we believe are reasonable but are subject to change and should not be relied upon. Past performance is not a reliable indicator of future performance. Neither any particular rate of return nor capital invested are guaranteed.