
UK Bond Blow-up: Isolated Incident or Canary in the Coalmine?

Chris Watling, Longview Economics
"Truss’s drive for growth proved too radical for traders. The pound was sent spiralling to reach its lowest value against the US dollar, an embarrassing intervention from the central bank – the Bank of England – was made to avoid a raid on pension funds, and rebukes from foreign observers, including the International Monetary Fund (IMF), were swift.”
Source: The Guardian newspaper, 30th September 2022 https://www.theguardian.com/uk-news/2022/sep/30/liz-truss-uk-economic-crisis
In late September the UK’s new Prime Minister (at that time), along with her new Chancellor, enacted an unfunded mini budget of broad ranging tax cuts and fiscal (energy) giveaways. The market reaction, well known and widely covered by the world’s media, included a sharp sell-off in the currency and the UK’s government debt. UK 10 year bond yields moved swiftly higher from late September through to the announcement, rising by around 150bps in a week.
Since that time, the Chancellor has been sacked, the Prime Minster changed and almost all the mini budget policies reversed. Furthermore the new Chancellor and PM have brought back fiscal austerity with a promise to finish fully balancing the books when they announce their full fiscal update in mid-November.
Fig 1: UK 10 year GILT yields (%) – 30 day timeframe
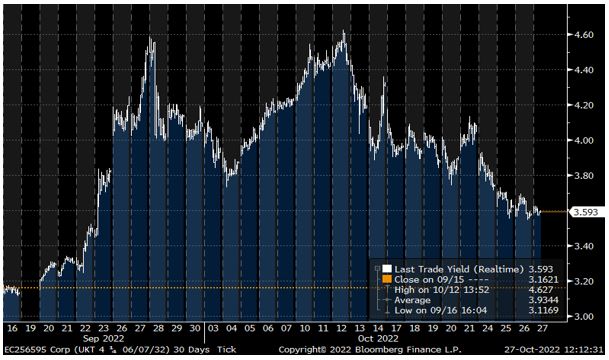
In the UK bond market, therefore, it seems clear that the vigilantes are back.
Is this, however, simply a UK specific problem and, as such, of no relevance to other parts of the global economy? Or is the UK the first manifestation of the problems created in the global financial system by a decade of cheap money? In other words is the UK the proverbial ‘canary in the coalmine’? And, if it is that ‘canary’, then what does that mean for investors?
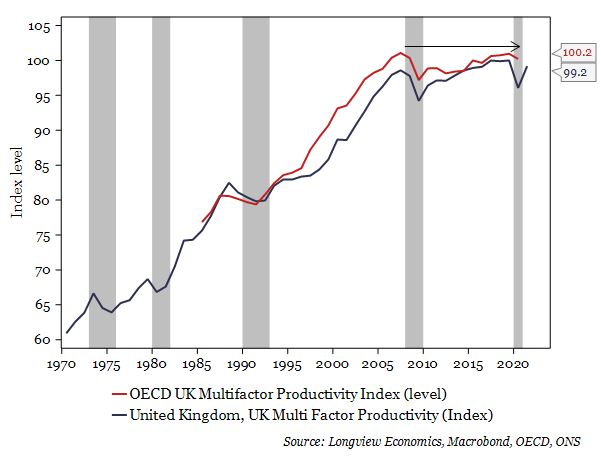
UK specifics: The UK economy has clearly struggled to generate decent economic growth this past decade. Post the GFC, and especially post BREXIT, the UK economy’s GDP per capita performance has slowed to low growth rates. With that, its relative economic performance against its European neighbours has deteriorated, whilst its productivity growth has been close to zero (cumulatively since the GFC, FIG 2), and its current account deficit has widened. On the latest data, the UK’s current account deficit was 5.5% of GDP (Q2 data).
As such, therefore, and while that deterioration has been accelerated by the energy crisis in Europe, the UK economy was, and remains, a prime candidate for a ‘bond buyers strike’, especially when the government announced an unfunded fiscal package which, by definition, would require increased government bond issuance, at a time when global bond markets were selling off (and the Bank of England) was about to start its program of Quantitative Tightening (i.e. also selling bonds).
So clearly, the UK’s economic backdrop added to its market risks, with that exacerbated by the leverage in pension fund portfolios (and their subsequent margin requirements/forced selling).
Fig 2: UK’s multi factor productivity level shown with UK recession bands
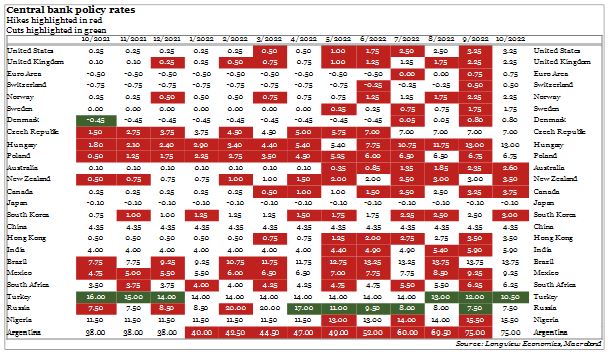
Global implications: The main cause, however, for the UK bond SELL-off is the reversal of a decade of cheap money, which has been a global phenomenon. Indeed central banks across the globe have been aggressively raising policy rates in 2022. In the US, for example, policy rates have moved from 0.25% at the start of 2022 to 3.25% latest data (with that rate expected to move to 4% at the early November meeting). Other central banks have behaved similarly, some more aggressively. The table below shows the movement in central bank policy rates for 25 key economies. It’s a ‘sea of red’ (NB rate hikes are shaded in red).
Fig 3: Key central banks monthly policy changes (past 12 months)
Reflecting such rapid changes in monetary policy, government bond yield curves have also been adjusting rapidly. US 10 year yields, for example, started the year at around 1.50%. By last week they had reached 4.25%. The trend has been the same in Australia, Germany, the broader Eurozone, Canada and many other countries.
Intriguingly, though, and despite the current high levels of global/Western inflation, the main driver of that higher nominal yield has not been the implied inflation priced into the bond market. Indeed implied 10 year inflation, which is embedded in the US nominal bond yield, is essentially unchanged in 2022. Having started the year at 2.56%, on latest data it’s at 2.44%. The key driver of higher nominal yields has been a repricing of the real discount rate. That is, the TIPS/real yield which has moved from -1.04% (at the end of 2021) up to +1.60% (latest close).
As that discount rate has revalued upwards, asset prices across the globe have been devalued.
Going forward, though, the key question is twofold:
i) Will those higher global bond yields and policy rates trigger more incidences like the UK pension fund debacle? And
ii) have yields shifted to a permanently higher level, and if so, what does that mean for investment trends over coming years?
1. Impact of higher global bond yields
The sell-off in bonds this year ranks as one of the sharpest bond bear markets in decades. US 30 year bond futures, for example, were down 26% this year (at their worst earlier in October). In that sense, therefore, this has been the most dramatic bond market move, in a short space of time, since the start of the futures data (early 1980s).
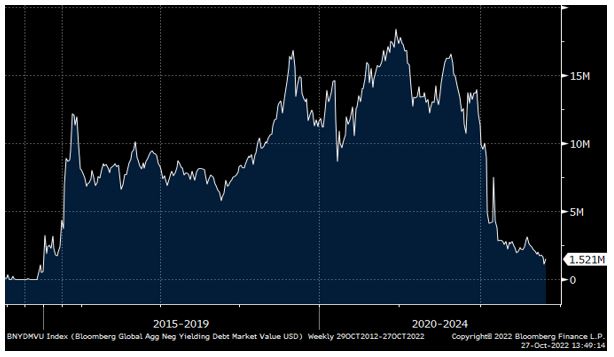
Consistent with that, the total amount of negative yielding government debt in the global financial system, having peaked at around $17 trillion in 2020, is now around $1.5 trillion.
Fig 4: Global negative yielding government debt (total, US$tn)
The unprecedented nature and extent of the bond bear market in 2022 illustrates why UK pension funds got into trouble. That is, they had used history to help them judge the extent of the stress that might emerge in their portfolios. Unfortunately, though, the effect of a cheap money decade and its sharp reversal generated an unprecedented shock that their stress testing hadn’t foreseen.
That (stress testing) problem is unlikely to be unique to British pension funds and has probably been replicated across a wide variety of global portfolios. Indeed a classic 60-40 balanced portfolio has experienced its worst performance in 100 years this year. Or put more simply, some funds somewhere are holding the significant losses generated by the move in the bond market, illustrated by the shift from $17 trillion negative yielding debt to around $1.5 trillion today (see chart above).
Future dislocations in financial markets, therefore, are likely to emerge as it’s unlikely that the British example is simply a one-off. Where those dislocations might emerge is one of the key questions for investors. The answer lies in who owns the government debt (and other related fixed income instruments) and, arguably more pertinently, how are they treating it? That is, is it being leveraged up to generate more income, or used in repo agreements for borrowing or other similar financial engineering type of actions. As money continues to tighten, therefore, we would expect more of these incidences to emerge.
2. Bond yields – a new permanently higher plateau?
Beyond the challenges of the unwinding of that fixed income-linked leverage in global portfolios, and looking out 3 – 5 years, the key question is: Where are government bond yields likely to stabilise? Are yields about to return to their low levels of the post GFC decade? Or are they returning to something more normal?
In our view, the rebuilding of household and bank balance sheets, which characterised western economies post GFC, is now over. Banks are well capitalised, households have paid off debt, while mortgage borrowing in the past 10 years has been limited. With that, the pandemic stimulus completed that rebuilding of balance sheet strength and set the stage for a new shape of Western/global growth. In particular trend 10 year bond yields should be higher (perhaps typically around 3 – 4%) as growth is less scarce, and the global economy less deflationary (more inflationary). In the near term, as the current high inflation passes and the bond market starts to think about recession in 2023, we would expect bonds to rally/yields fall. Beyond that, though, that 3 – 4% range is made up of around 2% trend real GDP growth plus around 2% inflation. Naturally there is room for error around those forecasts. That, though, is likely the central range, assuming policy makers don’t repeat the mistakes of the pandemic when they over stimulated.
Fig 5: Distribution of US single stock forward PE ratios (percent of total in each PE band)
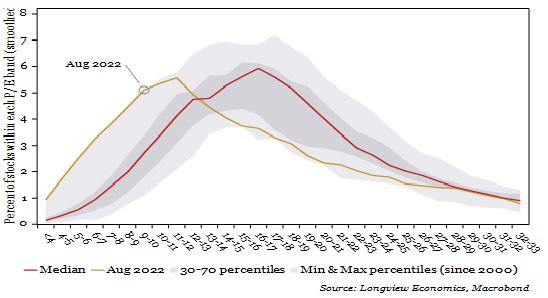
In terms of equities, therefore, styles should also shift. In the past decade, the world was dominated by deflation. Bond yields were therefore structurally low which created a strong set up for growth stocks (& tech). Structurally higher yields in the next decade, though, as a result of a better/stronger mix of economic growth and inflation, should favour the non-growth (i.e. value) sectors of the global equity market. In that respect the market is already starting to generate significant disparities, highlighting the potential for long term investors over coming quarters to pick up attractive cheap stocks. Non US equity markets are already cheap (e.g. see UK, Eurozone and EM equity indices’ PE ratios). Equally, even within the US market, there is a wide discrepancy between key growth stocks and the rest. As FIG X shows, the distribution of 2,000+ US single stocks by PE ratio is notably leftward skewed, highlighting the emerging opportunities that are appearing even in the US market, which are away from the growth areas of the index. For long term investors over coming quarters, once the worst of the ‘blow ups’ described above have passed, opportunity is increasingly presenting itself.