
US Recession: Cancelled, or just Delayed?
Chris Watling, Longview Economics
The ‘no recession’ mantra has become more popular in financial markets in recent months.
The bulls on the economy are pointing to various factors, including that:
- the Fed appears to have won its battle against inflation and its tightening cycle is advanced
- the debt ceiling issue has been resolved
- trouble in the banking system has been exposed (and seemingly addressed and priced in)
- some US housing data has turned higher
- forward earnings estimates have started to stabilise and, in some cases, turn higher; and
- the US economy is potentially in the midst of an ‘AI revolution’.
With the US stock market sharply higher than its March trough, led by AI/long duration growth stocks, the recession argument is being challenged.
Indeed market participants are wondering: Is the recession cancelled? Or is it just simply delayed?
Assessing recession risk has been harder than normal in recent quarters, with the pandemic clearly creating unusual behaviour in various parts of the economy: The frenzy in goods buying during lockdown, and subsequent switch to services, is one well known example of that. The challenges in the car supply chain (and the lack of cars) are another, as is the ‘work from home’ trend during and post the pandemic. All this has distorted economic behaviour.
One of the key factors which has delayed the onset of recession, has been the large cash piles built up in the pandemic as a result of both the extra cash given out by governments and households’ reduced spending. This raises a key question: When will the cash run out?
When Will the Cash Run Out?
“Brian Moynihan added that data shows consumers are spending less, pointing to an incoming recession.”
“The Fed won't hit its 2% inflation target until 2025 - and consumers spending less shows recession is coming, Bank of America CEO says.”
Cash piles have been one of the main factors creating resilience in the economy. Once it’s gone (or mostly gone), then the recession will likely start.
The key question, therefore, is: When will that extra cash run out? Bank of America’s CEO Brian Moynihan (who sees a lot of bank account data*) recently suggested that their consumers are already reducing their spending because of lower cash balances.
The evidence, broadly speaking, supports that view. On our calculations**, US households reduced their excess savings balance down to $523 billion by the end of Q1 2023 (from a peak plateau of $1.82 trillion from May to August 2021), see FIG 1.
FIG 1: US households’ ‘excess cash’ (level, US$, billion) as of Q1 2023
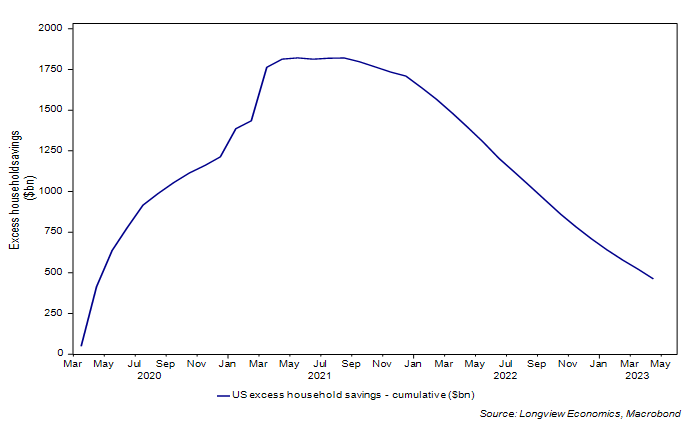
Recently, the level of ‘spare cash’ has been drawn down by ~$230bn per quarter. At that run rate, therefore, the cash pile will be largely exhausted by the end of Q3 (and probably close to ZERO by the end of this year).
Given that backdrop, the key question remains: Once the ‘spare cash’ is drawn down to low levels, will the US and global economy then roll over into a recession (i.e. in the next 6 – 9 months)? Alternatively, has that cash buffer somehow offset the initial shock of high interest rates such that the US will now avert a recession?
The evidence increasingly suggests it’s the former. In our view, for four key reasons, a US recession is likely to begin later this year/early 2024:
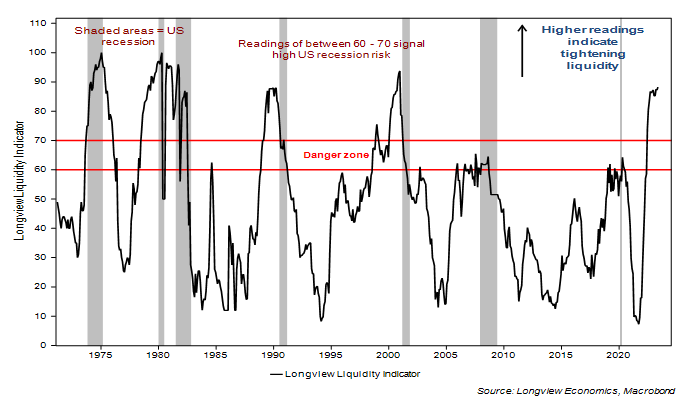
The Longview Liquidity Indicator is warning of a US recession. This model is designed to measure the tightness of Fed policy and whether it has over-tightened. Readings of 60-70 are in the danger zone and warn of a heightened risk of tight money/recession. The current reading is +90, see FIG 2. All readings of 80 and above in the past 50 years have correctly signalled a forthcoming recession. In other words, because of that ‘tight money’, it’s highly likely that the US credit and economic cycle will turn notably lower in the next 6 months.
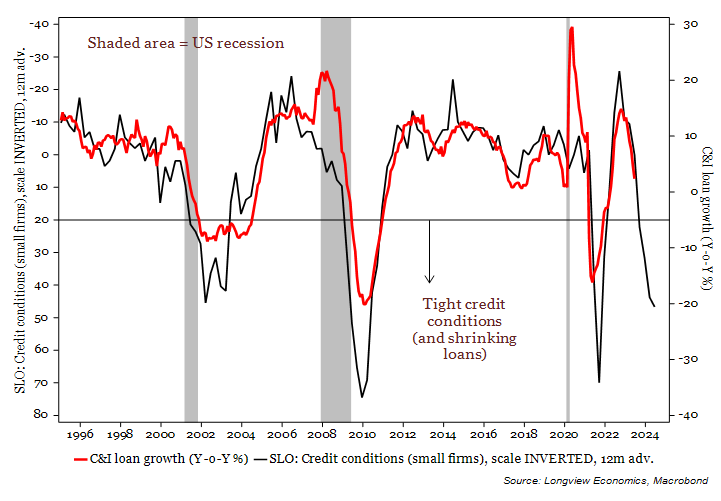
Indeed, the current tightness of credit conditions, as shown in FIG 6, suggests that outstanding lending to the corporate sector, all else equal, will likely shrink by around 5-20% Y-o-Y, by the end of the year.
FIG 2: Longview US liquidity indicator shown with US recession bands
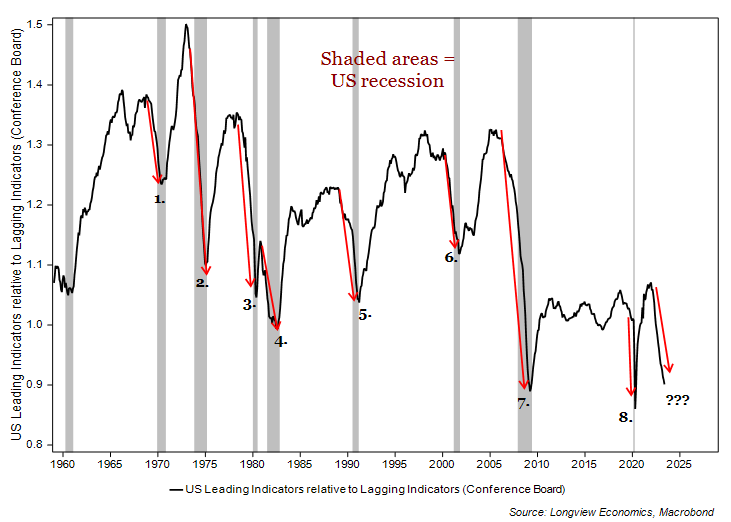
Leading indicators are falling sharply relative to lagging indicators, see FIG 3 below. This is the ninth example of a marked fall in the Conference Board leading index, relative to the lagging one. On all the other eight occasions, a sharp fall occurred ahead of/into a US recession. If history is any guide, therefore, a US recession should begin reasonably soon. Of interest in that respect, recessions typically continue until leading indicators start to turn higher relative to lagging ones as FIG 3 shows.
FIG 3: Conference Board leading economic indicators rel. to lagging (ratio)
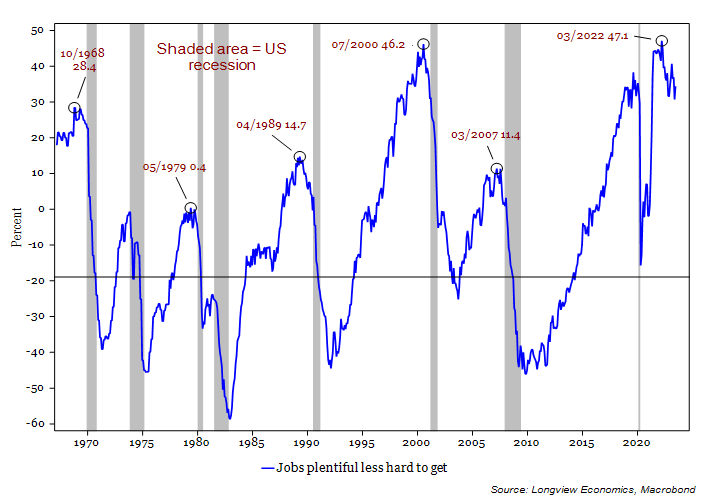
Labour market indicators are turning down. Most headline labour market data is lagging and not useful for making a forward looking assessment of recession risk. There are, though, a handful of select labour market indicators which do lead employment and the economic cycle. Those include the ‘jobs plentiful less jobs hard to get’ data. This is shown in FIG 4 below.
Typically, shortly after that indicator rolls over, the US economy enters recession. Of note, as shown in the chart, the level of this index is not relevant. It is the turn that counts. A turn appears to be underway after a local peak was reached in March 2023. Other key leading labour market indicators which point to rising recession risk include, the Kansas City Fed Labour Market Index, as well as the weekly initial jobless claims, as measured by the percentage change from its low in the past 12 months. All of which suggests that companies are poised to cut back on labour costs and shed jobs. Of interest, given reports of labour hoarding in this cycle, the speed of job losses may be faster than that of prior recessions.
FIG 4: US ‘jobs plentiful less hard to get’ shown with US recession bands
The manufacturing sector has further re-trenching ahead. Inventories remain at high levels, both in absolute terms and relative to sales. While the ISM inventory index has fallen to low levels relative to recent years, it probably has much further to fall. In other words, the excess in the manufacturing sector has not, yet, unwound. Manufacturing companies are likely to continue to cut back/retrench to de-stock their inventories. High inventories are also present in the wholesale and retail sectors.
Therefore, new orders warrant scrutiny. The ISM new orders index has been below 50 for the past 10 months. The cumulative number of points below 50 is currently 45, as shown in FIG 5. Usually, when that measure rises above 35, it’s consistent with a US recession.
Conclusion: At the start of the year, many were calling for a US recession to begin in 1H 2023. That view has clearly been wrong. Potentially, it was wrong because the consensus underestimated or ignored the buffer of ‘spare cash’ in US household bank accounts*. Critically though, most of the cash has now been spent. By year end it will likely be fully exhausted. There is strong evidence that money is ‘too tight’ and that the credit and economic cycle should therefore downwards. That view is confirmed by leading indicators, the deterioration of the labour market, and signs of ongoing weakness in the manufacturing sector.
FIG 5: ISM manufacturing new orders (cumulative points when index <50)
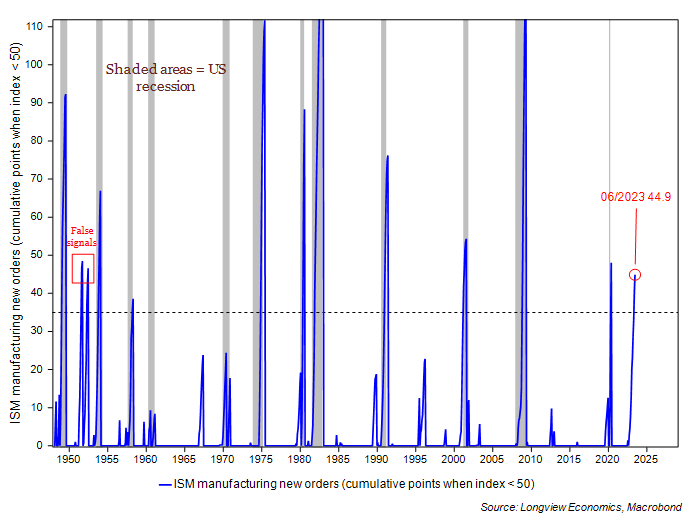
FIG 6: C&I loan growth vs. credit conditions (for small firms, scale INVERTED, 12m adv.)
*And/or possibly the lag with which US monetary policy works.