
Western Inflation: How Sticky is it…. Really?

“More recent data shows solid growth and continued strength in the labor market, but also a lack of further progress so far this year on returning to our 2% inflation goal,” the Fed chief said during a panel talk.”
“there has been much less progress in….domestic inflation … …the overall disinflation rate largely reflects the unwinding of the (global) supply shocks that were the primary source of the inflation surge in 2021-2022.”
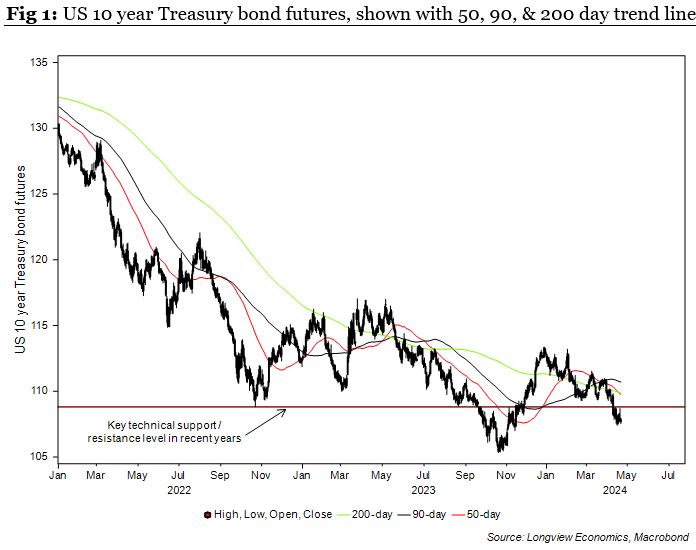
After peaking at double digit growth rates, Western inflation has fallen significantly in the past 12 months. On the surface, that’s encouraging and sets the stage for rate cutting cycles amongst major central banks. That, as and when it happens, would be a key source of strength for global markets, which have come under pressure in recent weeks (both bonds and equities). That is, US/global equity markets have moved lower in April while US Treasury futures have broken below a key level (fig 1).
The challenge, though, is that Western disinflation has been ‘lopsided’. In other words, it’s been driven by goods deflation, while services inflation has remained sticky. That’s most marked in the US, but it’s also the case in Europe and, to a lesser degree, in the UK.
Weak current goods inflation is not surprising. Goods prices surged on the 2020 & 2021 lockdowns and related global supply side shocks (as well as on the Russian invasion of Ukraine). Subsequently, the corporate sector over-ordered and over-stocked. That created the initial stages of the ‘bullwhip effect’ (as predicted by Michael Burry/others in 2022), and has now generated a deflationary impulse (enhanced by commodity price base effects). From a goods price perspective, therefore, the world is deflationary. That’s clear across CPI and PPI goods price indices in major Western economies (& elsewhere, e.g. China).
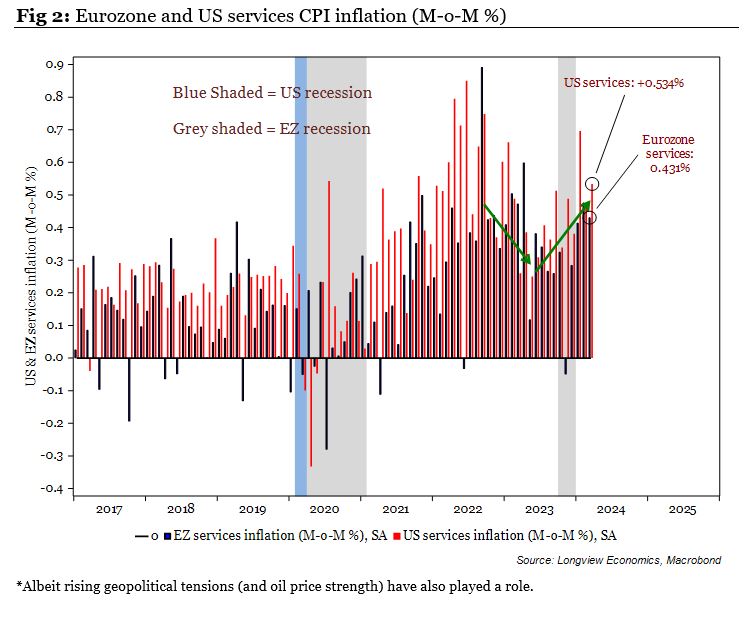
Sticky services inflation, though, has surprised markets. That is, despite easing in 2022 and early ’23, the underlying (M-o-M) trend in service sector prices has turned up in the past 6 – 9 months (e.g. see fig 2 below).
In the Eurozone, for example, it’s +0.4% M-o-M on latest data (4.9% annualised). In the US, it’s +0.5% (+6.2% annualised). Service sector prices are therefore the source of panic amongst policy makers, and the key driver of the recent repricing in front end rates. As such the market only expects 34bps of Fed cuts this year (down from 137bps). Linked to that, yields have moved higher across the curve in the West, the dollar has rallied, and cracks have been emerging in the equity market this month*. With that, there’s now strong consensus that inflation is here to stay, it's sticky!
The key question, therefore, is: Has the consensus got it right? Will the Fed, and perhaps other central banks, struggle to cut rates this year (e.g. see quote below)? Or is inflation less ‘sticky’ than many think? And, if so, who will cut first?
“Apollo’s Torsten Slok Says Fed Will Not Cut Rates in 2024; Chief economist flags surge in US growth, sticky inflation; “Fed will spend most of 2024 fighting inflation,” Slok said.
Inflation: Probably Not Sticky (three key reasons)
In the US (& elsewhere), three key factors point to notably weaker services inflation later this year.
Firstly, the US labour market is loosening. That’s the message of key leading indicators of job and wage growth, which have mostly turned lower. The number of people working part-time, because they can’t find a full-time job, for example, is trending up; companies are cutting back on ‘temporary help’ in the service sector; while ‘hiring intentions’, ‘new hires’, and ‘job openings’ are all trending down. Having (reportedly) hoarded labour 18 months ago, companies therefore seem poised to let go of ‘excess’ workers.
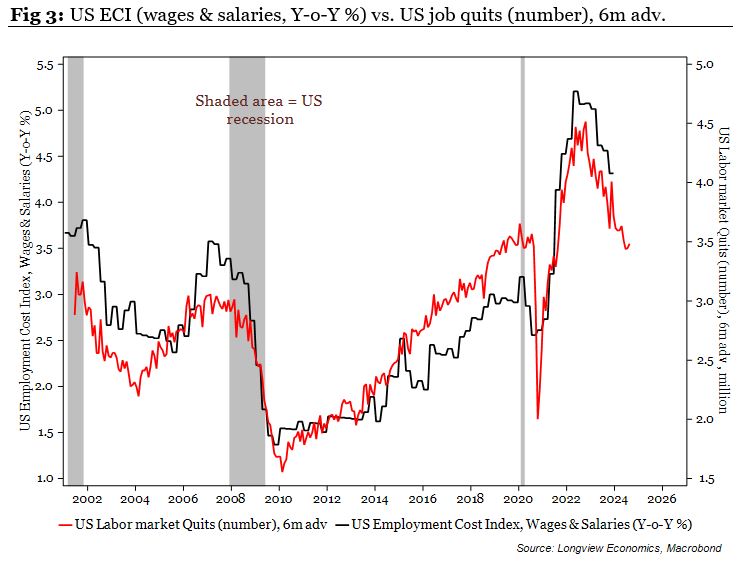
A weaker labour market typically drives softer wage growth. Indeed that trend is already underway (fig 3).
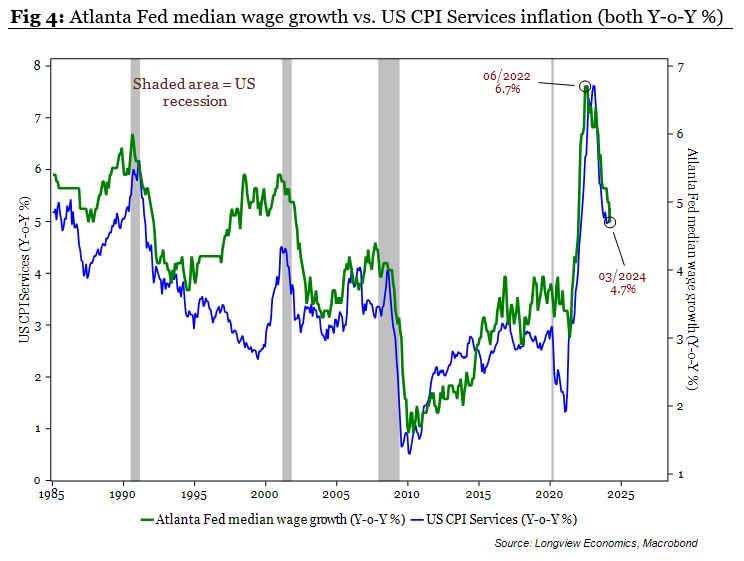
Softer wage growth then usually drives softer service sector inflation (see fig 4). A weaker labour market, therefore, and, in particular, lower wage inflation, should deliver that ongoing downtrend in Y-o-Y services inflation in the US.
Given that most of the ‘sticky’ inflation proponents base their argument on the ‘strong labour’ market (driving wage inflation, and therefore, generating sticky service sector inflation), that softer labour market is a key counter argument.
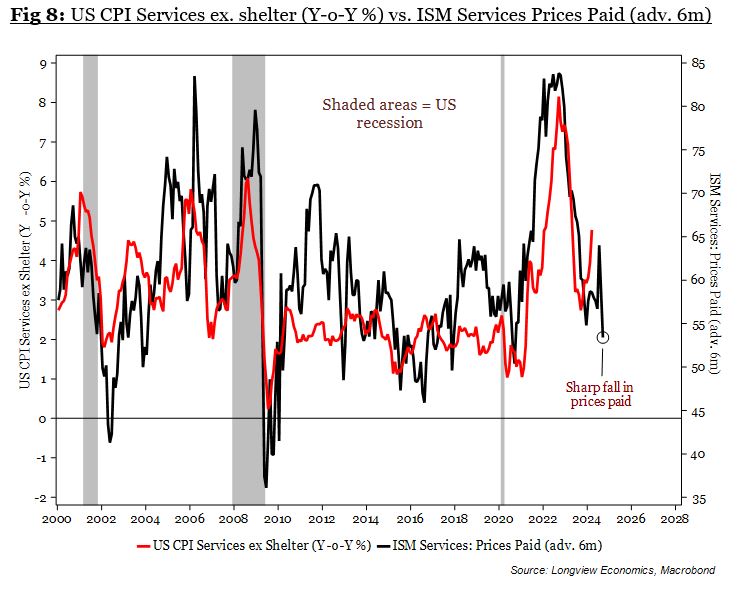
Secondly, and consistent with that outlook, several key forward looking inflation indicators have turned lower. The latest ISM services report, for example, showed that ‘prices paid’ fell sharply to one of its lowest readings in the past five years (see fig 8). As the chart shows, that index usually leads core services inflation (ex. shelter) by about six months (albeit the correlation is not perfect). Other leading indicators are (starting to) carry a similar message. The price outlook of small businesses in the US, for example, has eased somewhat in the past four months (and also typically leads services inflation).
Thirdly, money supply growth is contracting in most parts of the West (and on most measures). That’s the case, for example, for M1 money supply in the US, the UK, and the Eurozone. Most other (broader) measures are also shrinking in those economies (e.g. M2, M3 etc.).
High inflation in the past 18 months has probably been mostly driven by high levels of newly created money in the pandemic (i.e. by central banks, with that new money used to ‘monetize’ fiscal deficits). After the pandemic, there was therefore ‘too much money, chasing too few goods and services’. In that respect, strong money supply growth resulted in ‘monetary inflation’.
As such, and as Mervyn King suggested/warned, the contraction in money supply should increasingly generate a disinflationary impulse in Western economies:
“…The big mistake is to think that money has absolutely nothing to do with inflation… …inflation is a fall in the value of money. So you would think that the amount of money that central banks print would have something to do with inflation…”
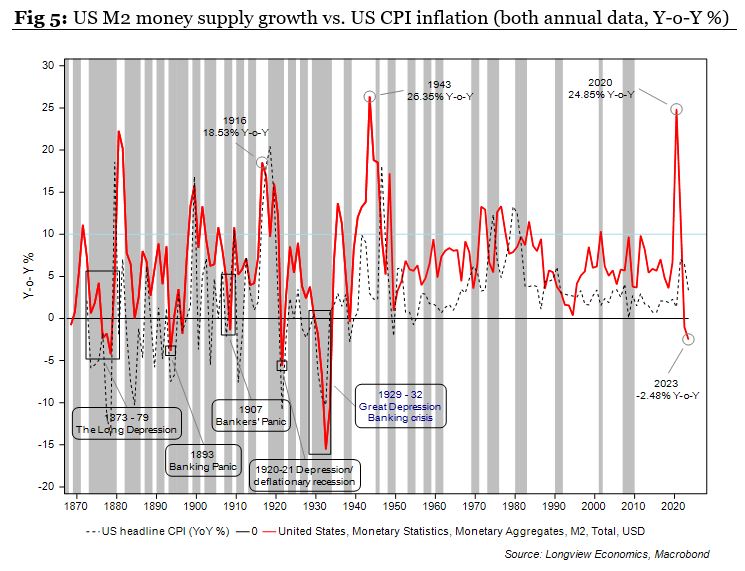
Of interest, in that respect, similar (rare) surges in money growth in history, show that once the money supply starts contracting, it’s followed a year or so later with deflation in CPI (e.g. see 150 year chart of US M2 money supply growth vs. CPI).
Who Cuts First?
Those three factors above, while mostly examined through the lens of the US economy, also apply to Europe. In particular Europe’s labour market outlook is poor, wage growth is trending down, money supply is contracting, while a number of forward looking inflation indicators have also moved lower.
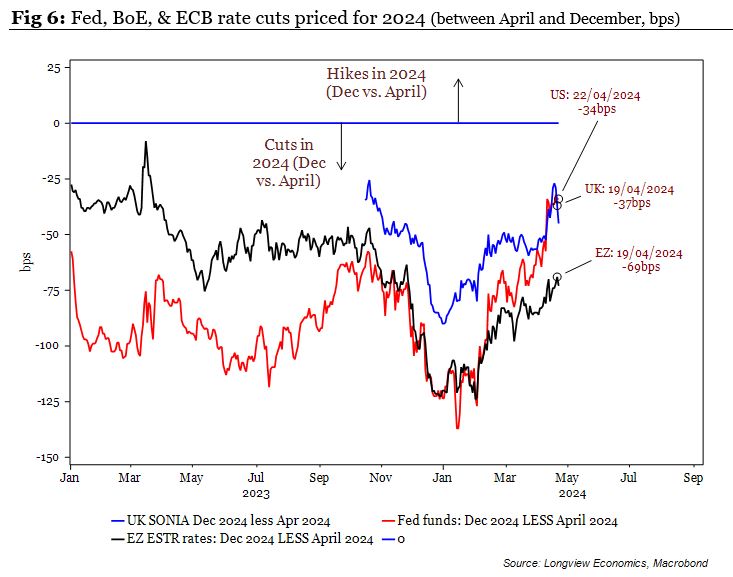
As such, in all those economies, there’s a heightened risk that rates markets will price in more central bank cuts for later this year (i.e. compared to what is currently priced, which is now relatively modest – see fig 6 below).
With all major Western economies likely to embark on rate cutting cycles later this year, therefore, the question becomes: Which central bank will cut first? And what will that mean for US and global equities?
In the past 18 months, the US, UK, and Eurozone have all had different ‘post pandemic’ economic growth paths. That, not surprisingly, has driven different expectations for their respective policy rates. In the US, where large fiscal stimulus has supported economic (and earnings) growth, Fed commentary has been more hawkish.
In the Eurozone, in contrast, most major governments have been tightening their fiscal balances**, real GDP in key economies has been ‘flatlining’; while, structurally, the ‘Japanification’ theme in the Eurozone remains alive and well*** (resulting in lower trend growth and inflation). Unsurprisingly, therefore, the ECB has hinted at earlier cuts compared to the Fed. That’s reflected in the rates market (with more ECB cuts priced relative to the Fed, see fig 6).
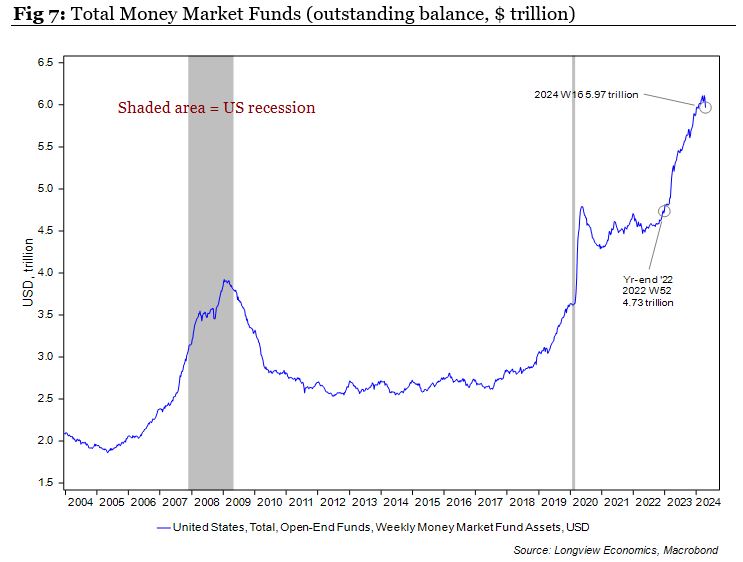
Either way, if our assessment is correct, and central banks deliver significant rate cutting cycles (which are larger than currently priced), that loosening of monetary policy should underpin both bond and equity markets. Of note, and while rate cuts, on their own, would be a net positive for the liquidity environment for US/global equities, they would also probably trigger the release of increasingly significant amounts of liquidity that has been locked up in money market funds (see fig 7). That, if it happened, would enhance equity market returns. Elsewhere it’s plausible that rate cutting cycles would be accompanied by the end of QT programs at the Fed and ECB.
As always, at these times, though, the question is whether (and by how much) equity markets would need to initially sell-off (i.e. to first force the hand of central banks and/or speed up their policy response). If our analysis above is correct, then history would suggest that such a pullback is both necessary, and a key buying opportunity.
***Europe’s structural economic themes are similar to Japan post the deflating of its bubble post 1990. Of note, and while Europe is not in the midst of a deflating asset price bubble, its working age population is shrinking and the workforce is ageing. A number of ‘deflationary themes’, which have been in place for the past decade, are therefore ongoing. They include, for example, ongoing private sector deleveraging and, linked to that, a downtrend the consumption share of GDP.